For over two years Australia’s media industry has suffered the debilitating monthly decline of advertising revenues – but all that is about to sensationally change.
The first glimpse of SMI’s Australian (and NZ) ad spend detail for April (ex Digital) clearly shows ad spend is already 20% above what was recorded in April 2020, while the total for May is just $900,000 shy of the total for all of May 2020.
This detail was revealed in the release of SMI’s final March 2021 ad spend data at the end of April, and in the press release, I described as “mind-boggling’’ the growth rates we’re now expecting.
The reason for this description was my quick glimpse at some of SMI’s Forward Pacings data – showing the total confirmed ad spend for the future 3 months – for the months of April and May.
Even though Agencies had not even finished paying for their April advertising inventory we could see ad spend for the Food/Produce/Dairy category was 69% above that of April 2020; Gambling category ad spend was soaring by 163% YOY; the Home/Furnishing and Appliances category was up 130%; Travel ad spend was up 98% and Clothing/Fashion Accessories ad spend was up 113%.
And the May data was equally spectacular, with the value of Food advertising up 68%, Travel ad spend up 170%, Specialty Retail up 350% and Movies/Cinema ad spend soaring 2,300% (yes, this category’s ad spend was virtually wiped out in May 2020).
So what levels of growth should we actually expect for Q2 2021? And how soon will the market return to the pre-COVID levels of 2019??

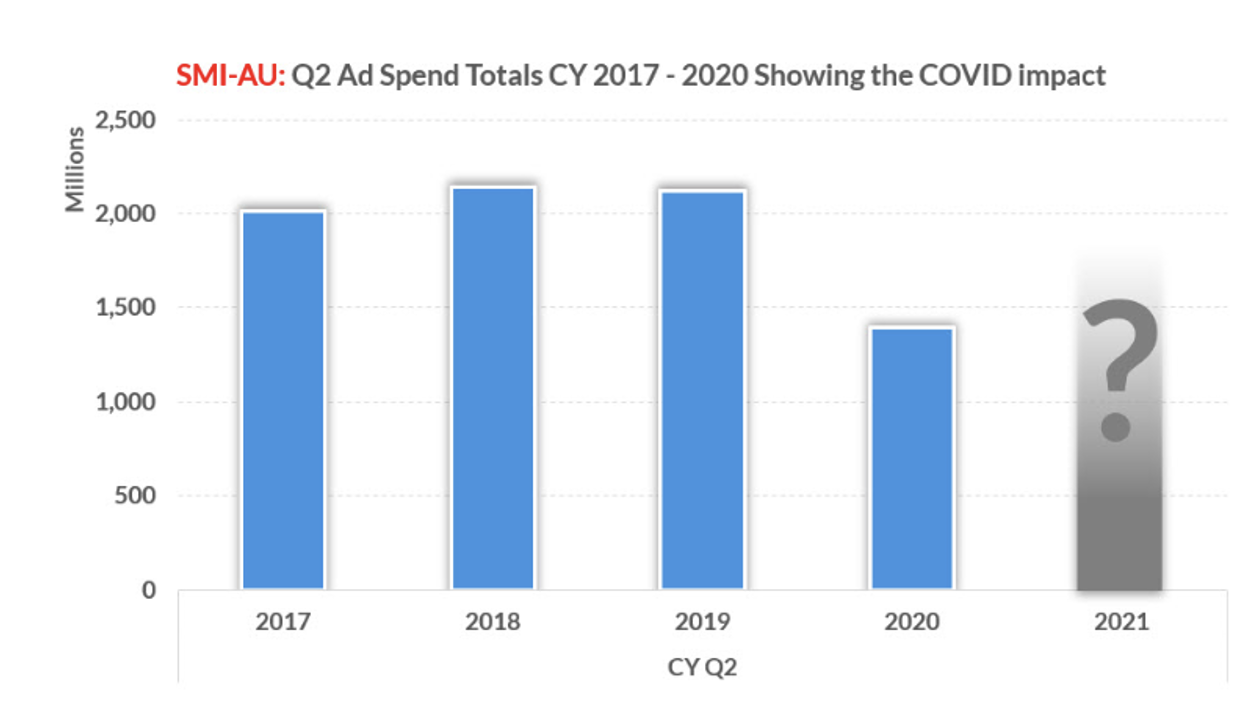
For the market to return to its Q2 2019 total it needs to make back the $730 million that evaporated during the April to June period in 2020. That represented a 34.3% fall in the market’s total Q2 ad spend, and it was the first year since 2016 that the quarterly total ad spend had fallen below the $2 billion mark.
When we look back at the Categories mostly responsible for that huge decline we can see the bulk of those lost revenues – just over $400 million – were attributable to seven key product categories.
Supply issues due to COVID hit Australia’s automotive brands hard
The largest fall of more than $100 million was in the market’s key Automotive Brand category as manufacturers were faced with severe supply issues due to COVID. And that level of decline remained consistent until the end of last year before the Category showed the first signs of beginning to stabilize. For the March quarter its total was back just 7.6%, or $11 million, suggesting it may soon be contributing to the market’s growth (in the early April data it’s media investment was just $1.8 million below that of April 2020).
Other categories which were large contributors to the Q2 2020 decline were Travel (back $96 million last Q2 but already up 98% in the early April data due to surging demand from Airlines and the Domestic Tourism Agencies subcategories), Gambling (back 47% in Q2 last year but already up strongly), Movies/Cinemas, Restaurants (-38% last year), Retail (-$49 million last year) and Political Parties/Industry Associations (-$55 million).
That means most of the categories reporting the largest declines last year are already showing positive growth, while many of the 30+ other categories are also already reporting higher ad spend in April and May.
Another factor in this question of ‘how much growth?’ is the types of media where the growth rates are the strongest. For the Q1 period, the Australian ad market is just in positive territory (+0.4%) but that belies the huge growth seen for Television (+5.0%) and Digital (+12%).
Outdoor advertising’s loss was TV gain
The ongoing COVID impact on Outdoor has most benefited TV which seems to have taken its market share as TV now accounts for 41.7% of all ad spend, which is its highest share level since 2016. Digital’s share of the total remains steady at 32.2% and Outdoor’s share has fallen 2%.
But given the size of most TV campaigns, the ongoing growth of this media bodes well for the broader market. For example, in Q2 last year Television’s ad spend fell by $283 million, so if its total ad spend returns to 2019 levels that’s already 40% of the market’s total Q2 COVID decline won back. And the amount contributed by TV will be even higher if the current growth rates are maintained.
Thankfully the SMI data is finally providing numerous positive signs about the market’s future growth. And given the future spend already booked in the system, it’s a fair bet that the market will return to 2019 levels sooner rather than later.
Connect with us today to learn more about how SMI’s marketing intelligence can help you make smarter decisions
Complete and submit the form below and we will be in touch soon.
"*" indicates required fields


