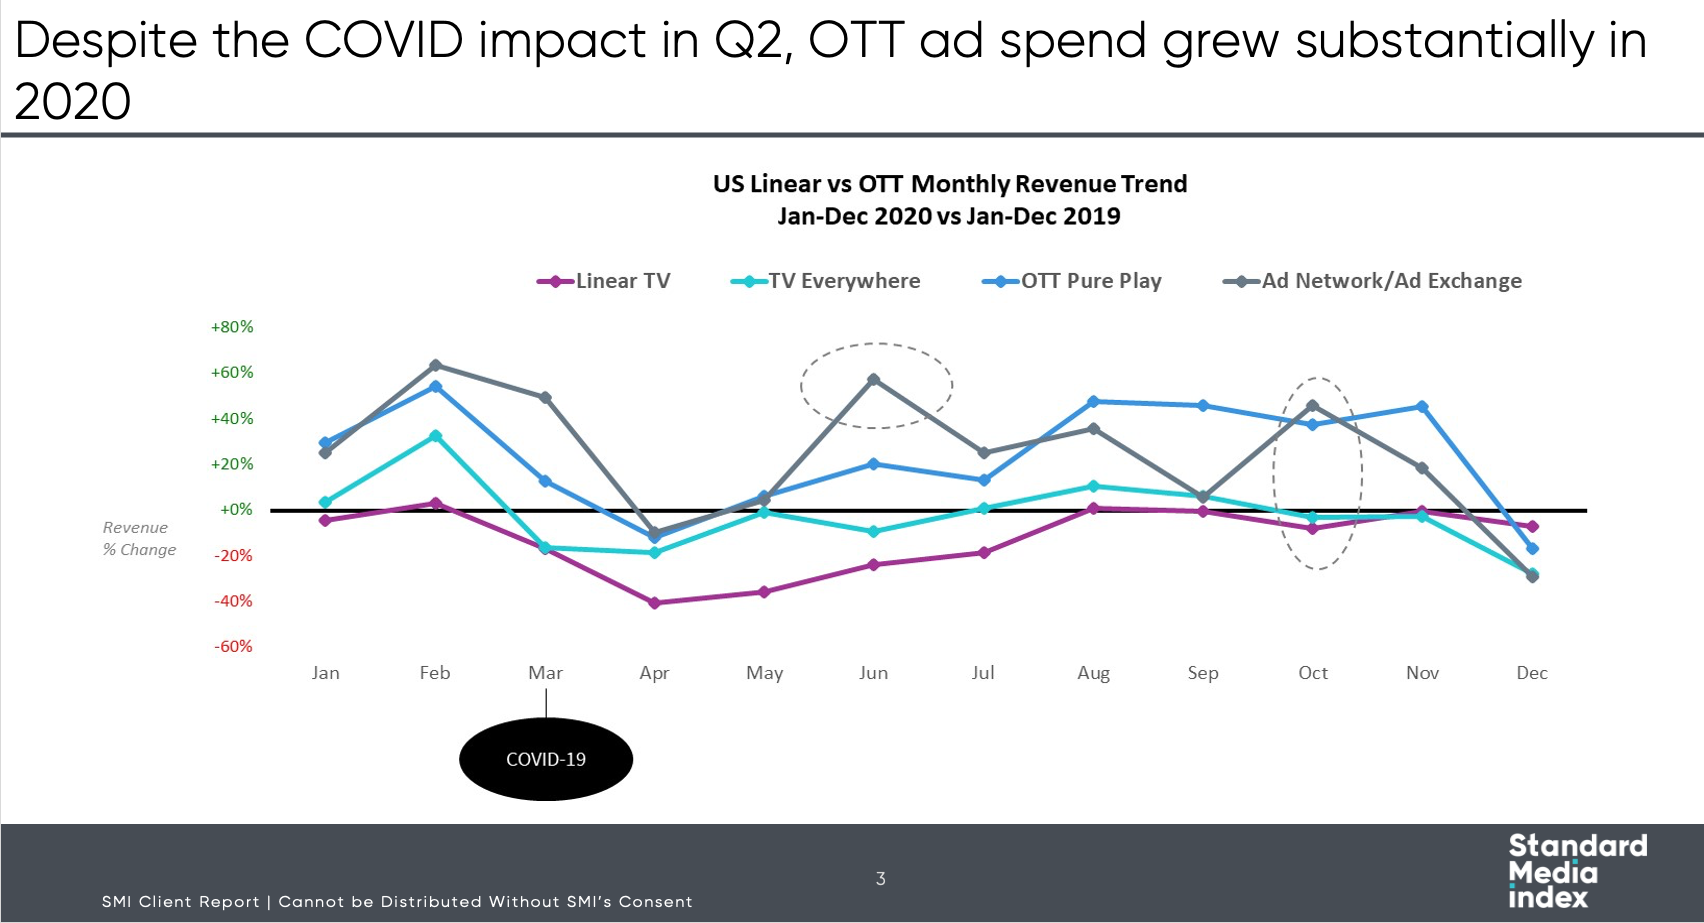
In 2020, despite the pressures of the pandemic, OTT in the US grew substantially, while OLV was up as well. It’s fair to say that, in the US at least, advertisers are eagerly embracing streaming video, which will continue to grow market share and command ever higher CPMs.

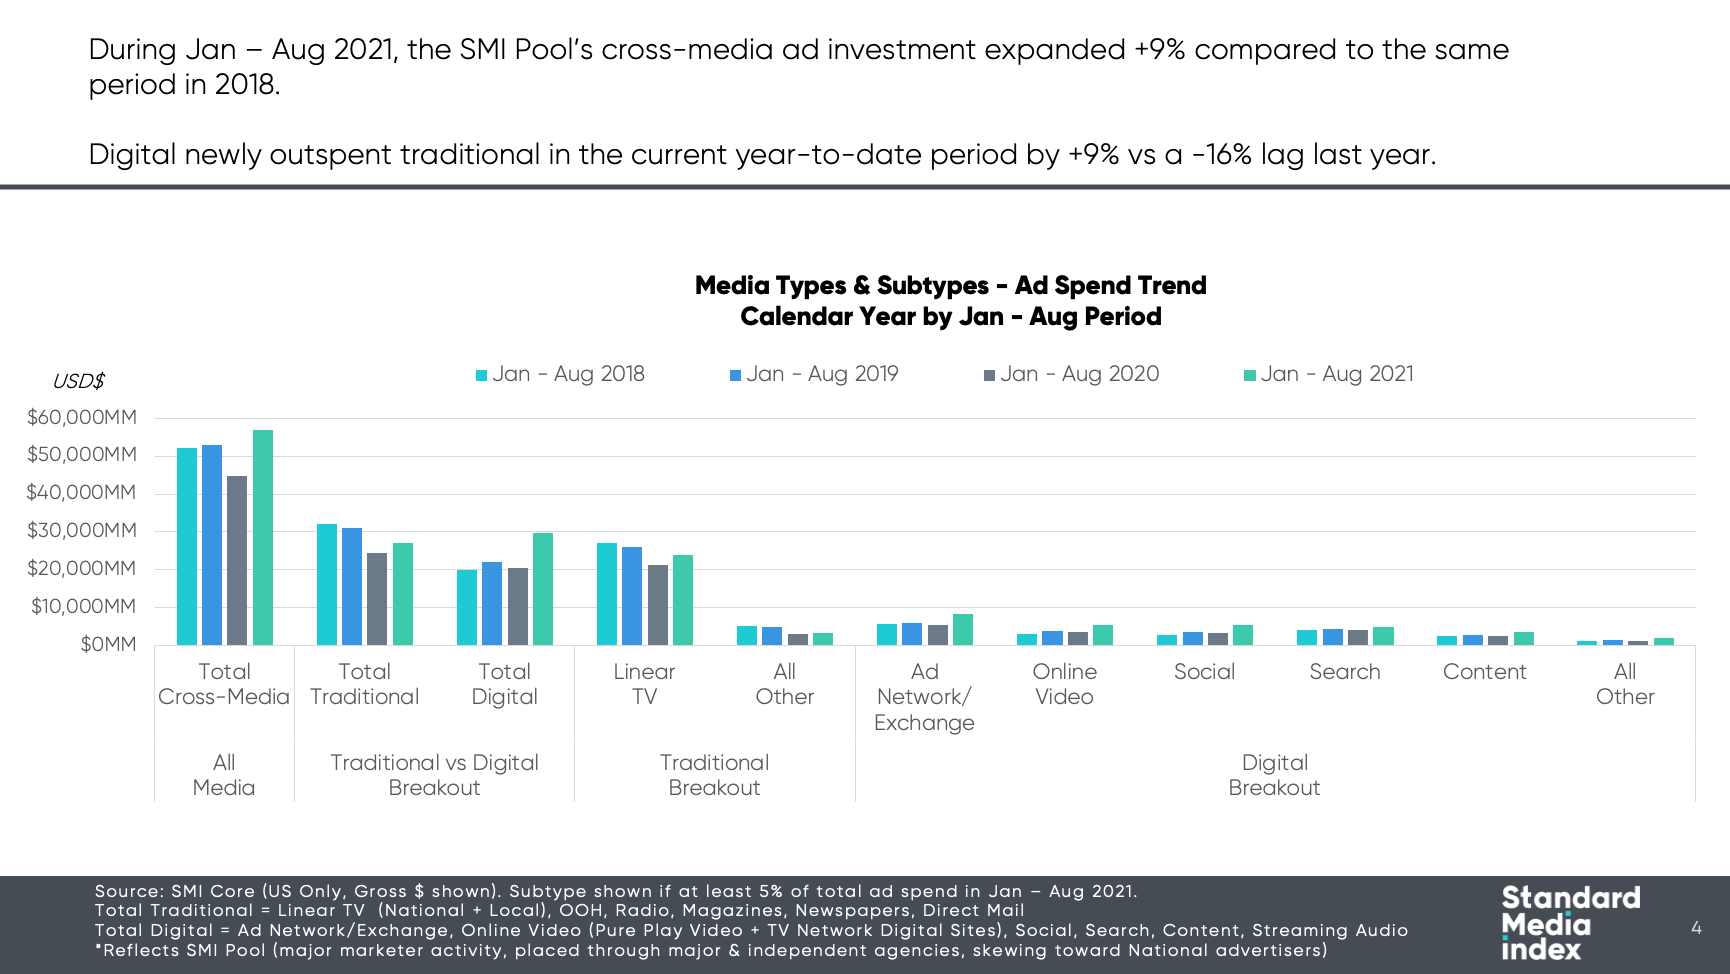
It’s a sign of continued expansion of the US digital video market, which includes the convergence with linear TV as well as video offerings from traditional print publishers. As UK companies step up the pace of video offerings, the US market offers a strong indication of where it is headed: ever upward. In just the last three years, for example, over the top (OTT) video grew 33% from 2019 to 2020, and 54% from 2020 to 2021 (see chart). All media companies are benefitting from the trend, as print publishers such as the New York Times, Wall Street Journal and others further ramp up digital video offerings, and traditional TV companies expand their digital channels. All of this while the non-video market grows, showing no cannibalism as search and display continue to grow as well.
From where we sit at SMI, tracking nearly $100 billion in US ad spending (and tracking to over $200 billion globally as we continue to expand into new geographies, we’re able to provide such accurate insights into this rapid evolution because of the ground truth of our data, which comes directly from agency invoicing and planning systems. Therefore, we are not estimating the market based on rate cards, we are looking at our pool of all of the agency holding companies and major independents, who represent over 90% of the national advertising spend market of the market. This enables us to provide a granularity of detail into both revenue and pricing. Why base decisions on estimates when you can know for sure?
As advertisers shift their spend to digital and the new online TV options such as addressable and BVOD, a transparent view into pricing will create growth opportunities across the media landscape.
Convergence is happening fast
While linear TV continues to bring in larger sums of overall spend, online TV is expanding more rapidly and in some cases overtaking linear, as it did in December 2020, when it accounted for 58%. In preparation for this future, and to their credit, smart media companies have been moving aggressively into the digital space, where myriad pure-plays and video offerings from print and others are giving viewers and advertisers a healthy range of choices.
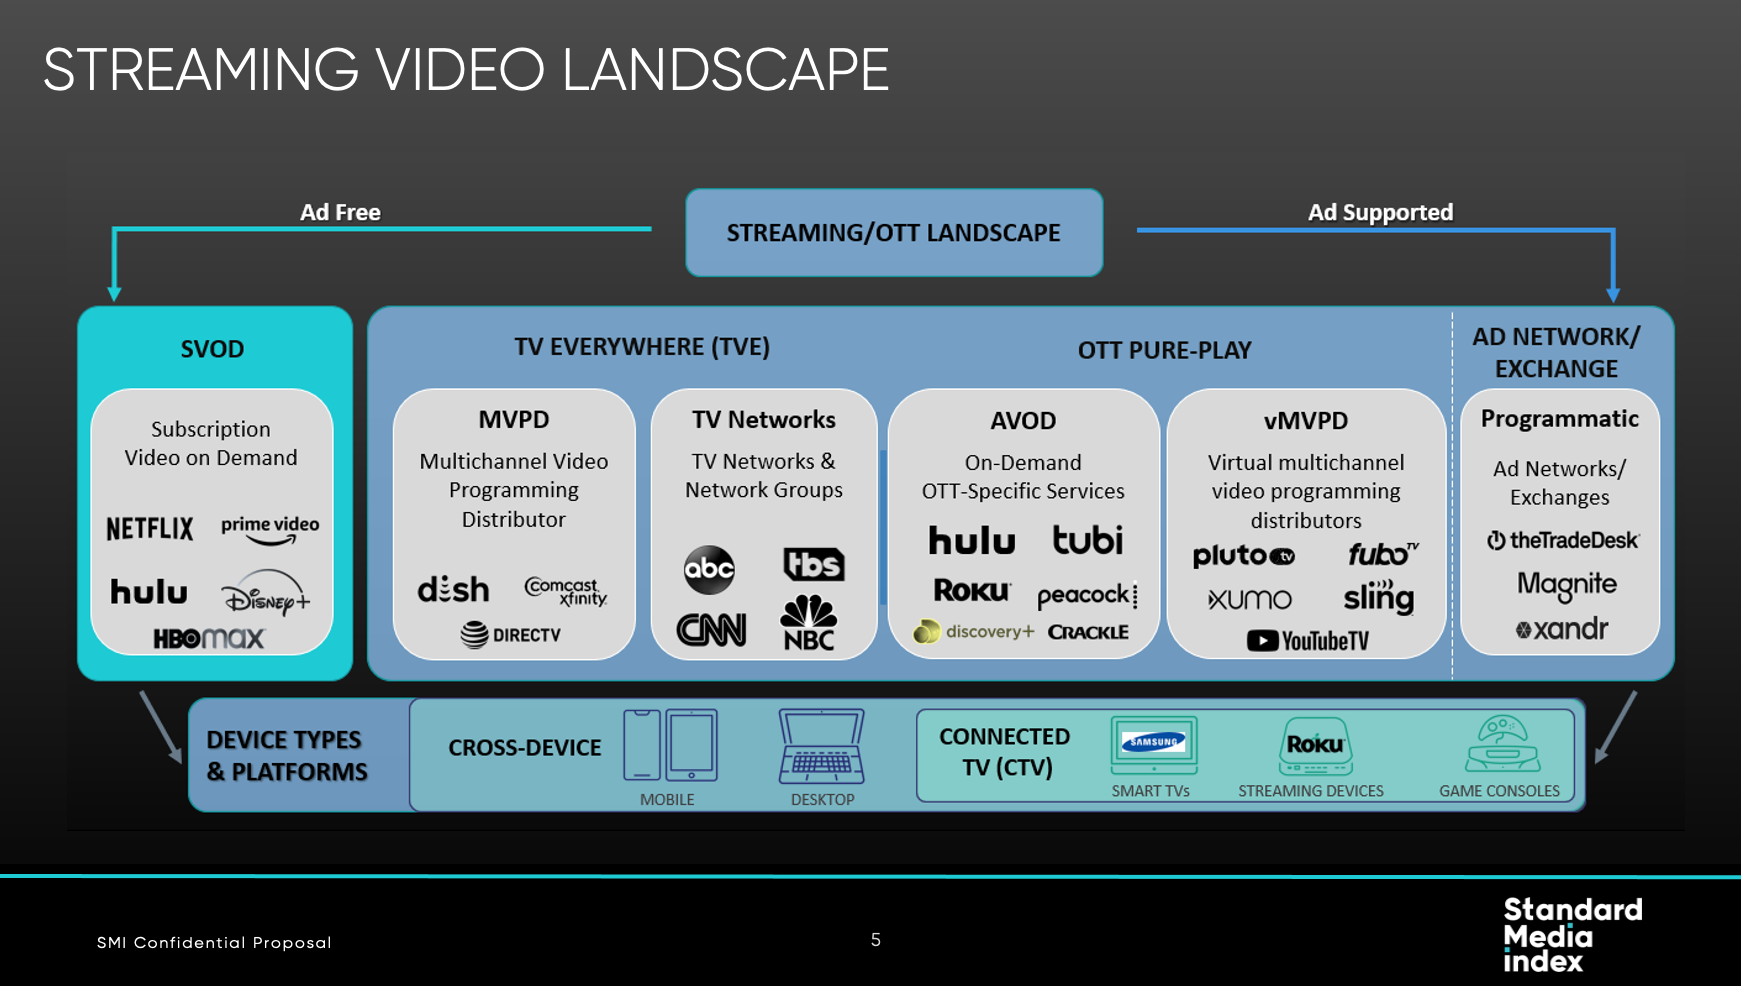
In the US, the market has expanded so quickly, it has splintered into a handful of types of video, from subscription video on demand like Netflix to advertising video on demand such as Hulu. Legacy distribution channels, such as cable and satellite, have carved out leading positions in video as a platform for streaming offerings with new approaches to the old cable bundle. For example, Disney+ and ESPN+ are bundled with Hulu.
Streaming video has held strong through the pandemic, rebounding and soaring after the dip at the end of Q1 2020. OTT pure-plays such as Netflix and Hulu outgrew the category; programmatic and exchanges continues to grow at a significant rate.
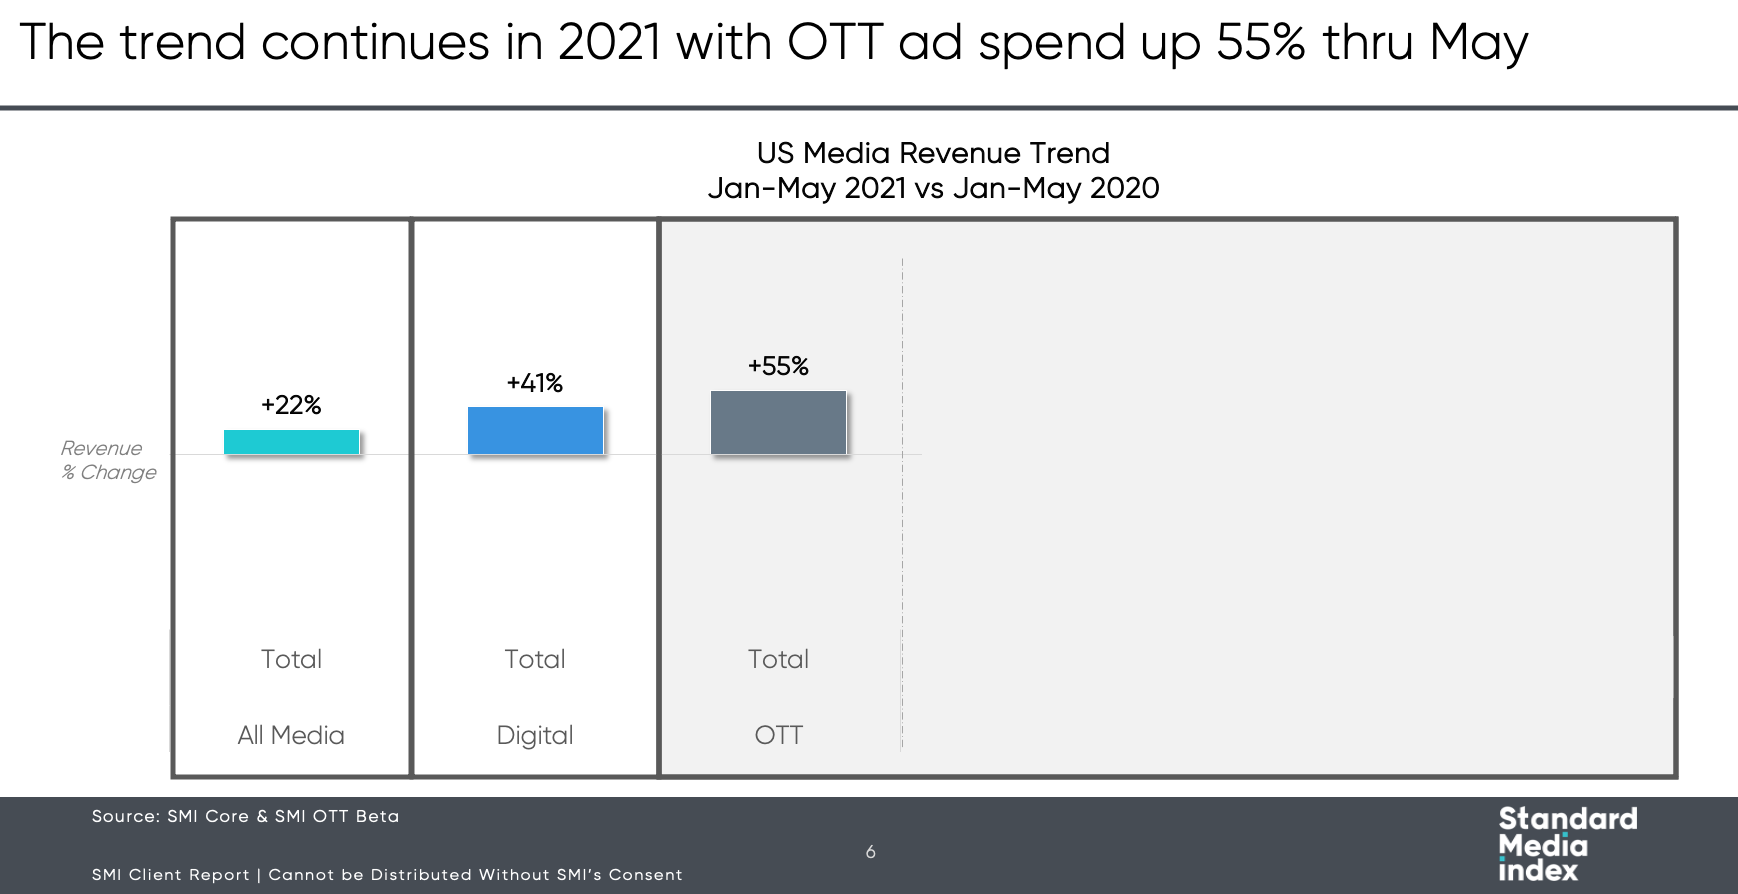
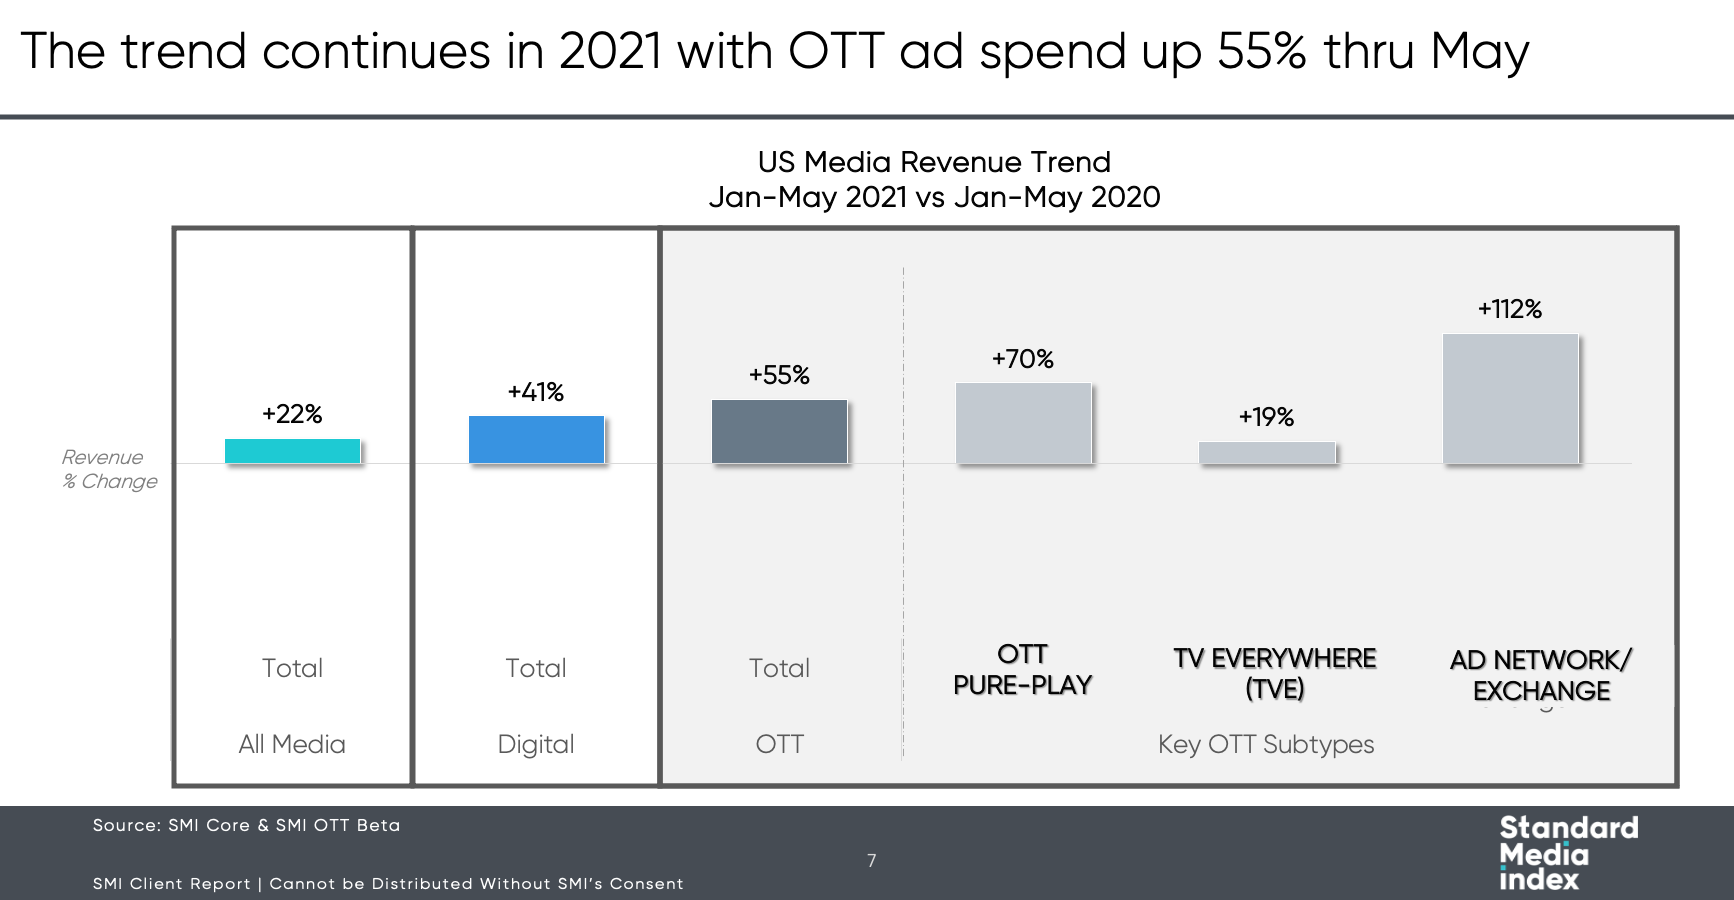
The growth has been dramatic. While the total advertising market grew 22% in the first half of 2021, video grew twice as much, with OTT vastly outpacing the market. Diving further into OTT, growth rates show how the option of buying TV programmatically is being embraced by advertisers at a fast clip.
Video commands a higher CPM
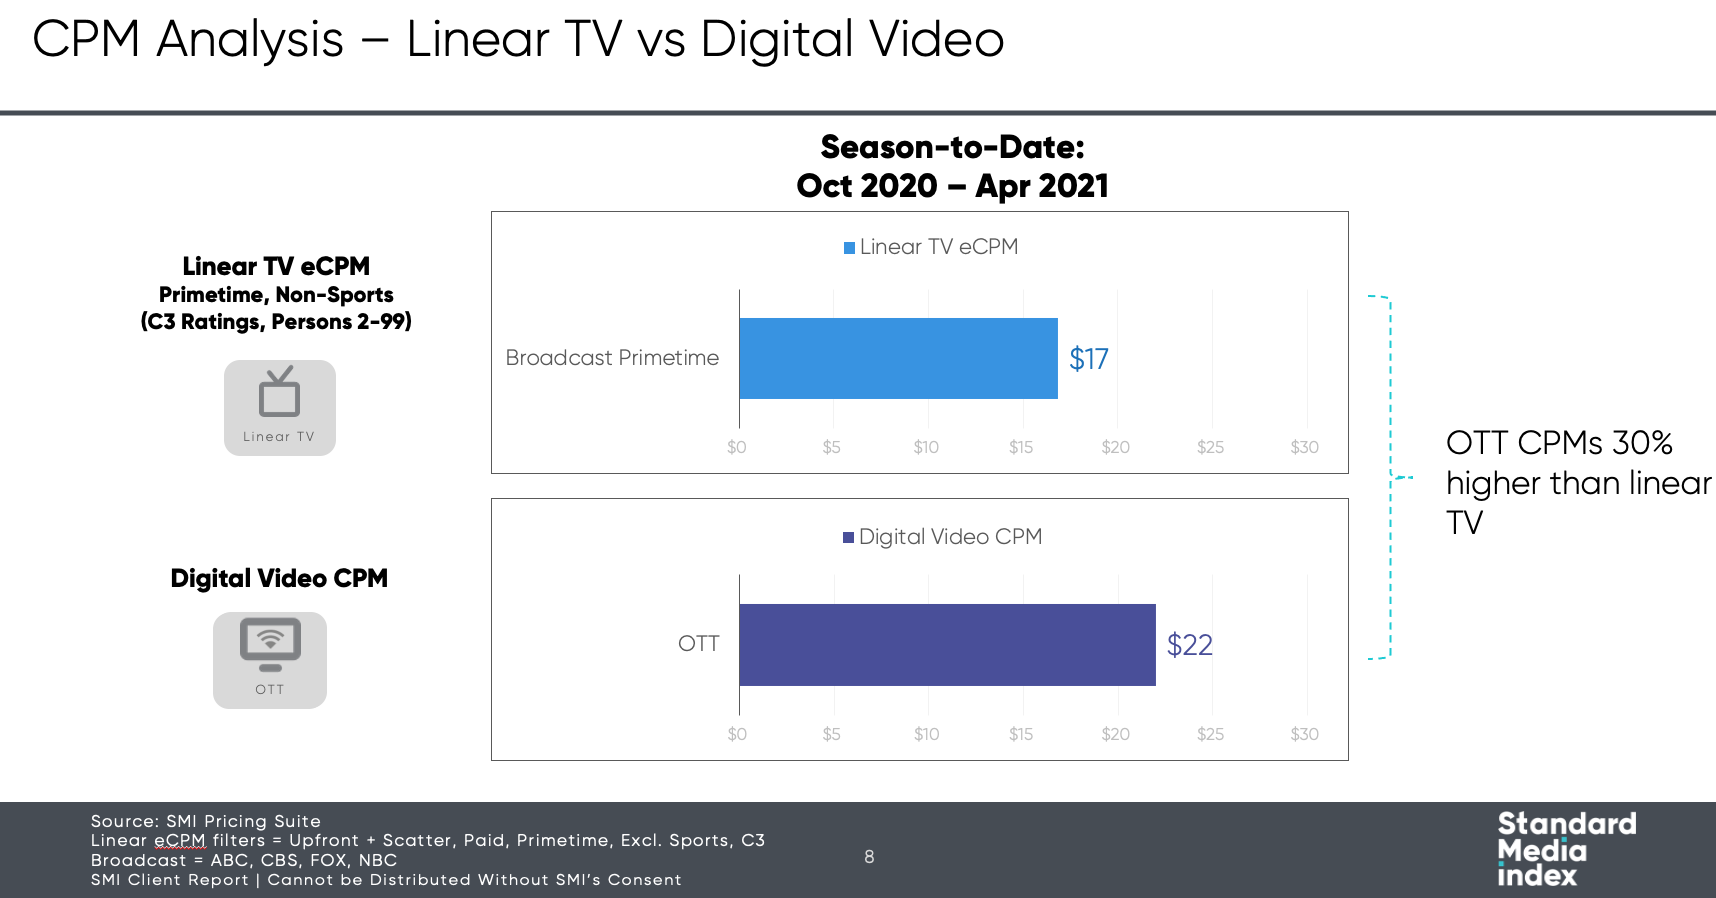
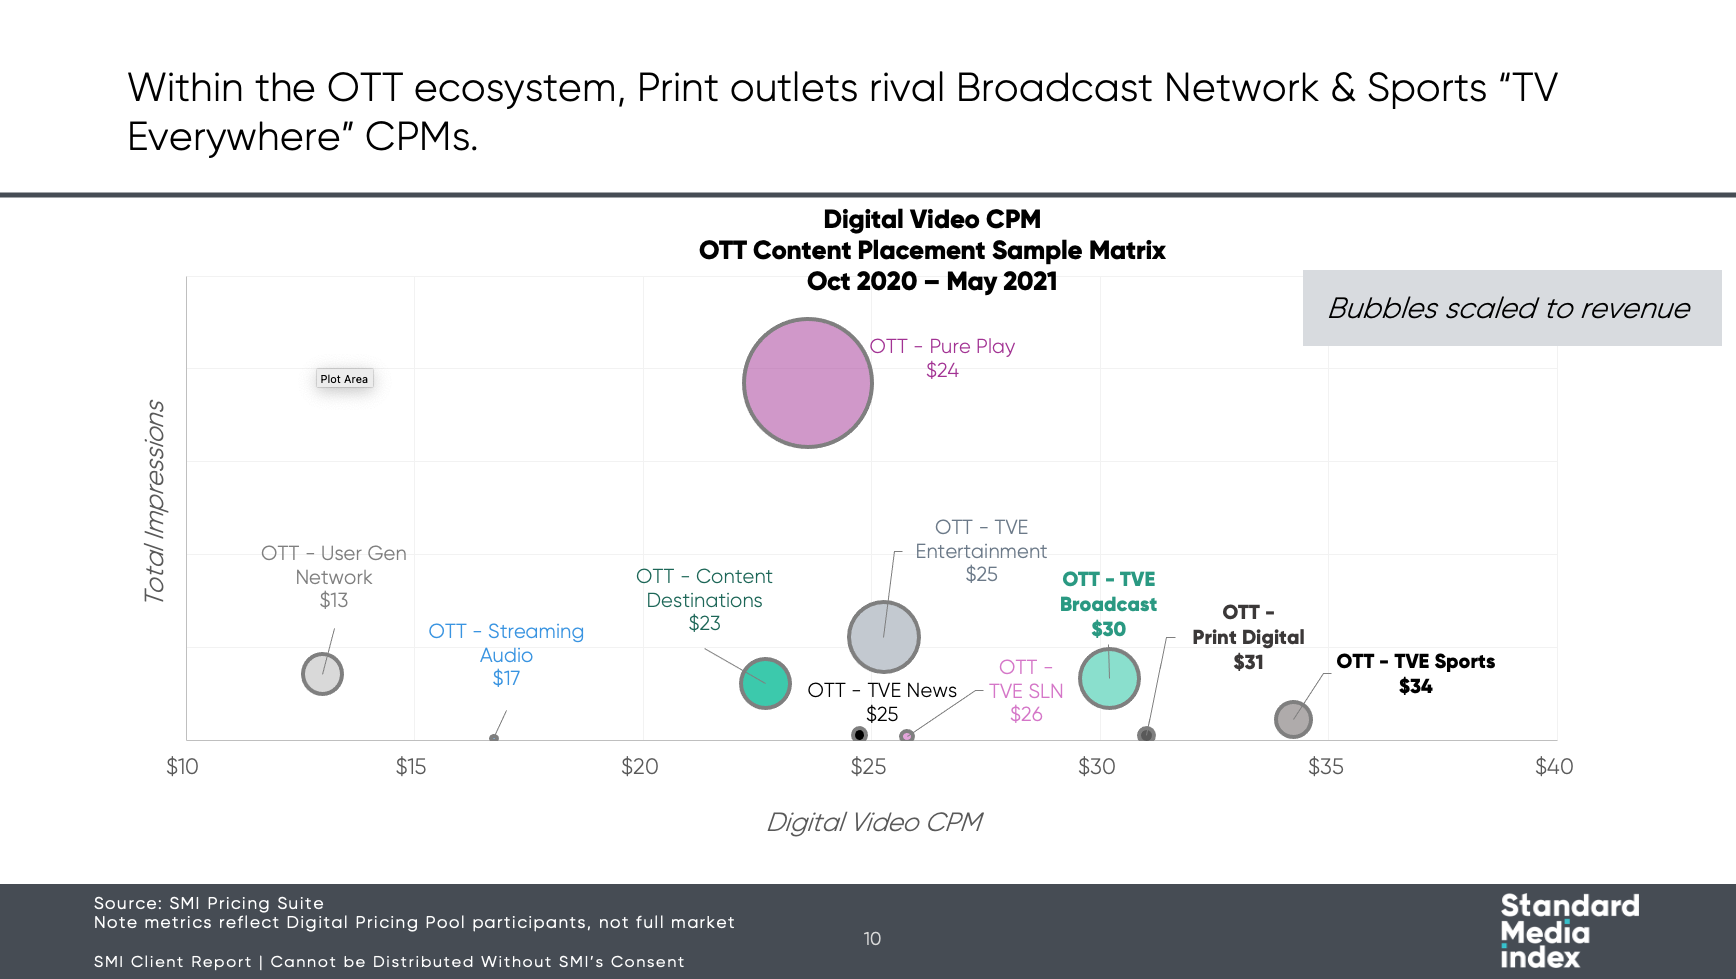
With its premium content and engaged audiences, digital video is drawing ever more demand, putting pressure on supply and therefore driving strong OTT CPMs. Between October 2020 and April 2021, OTT captured a 30% premium against like programming, and we’re seeing rates more than 10x display.
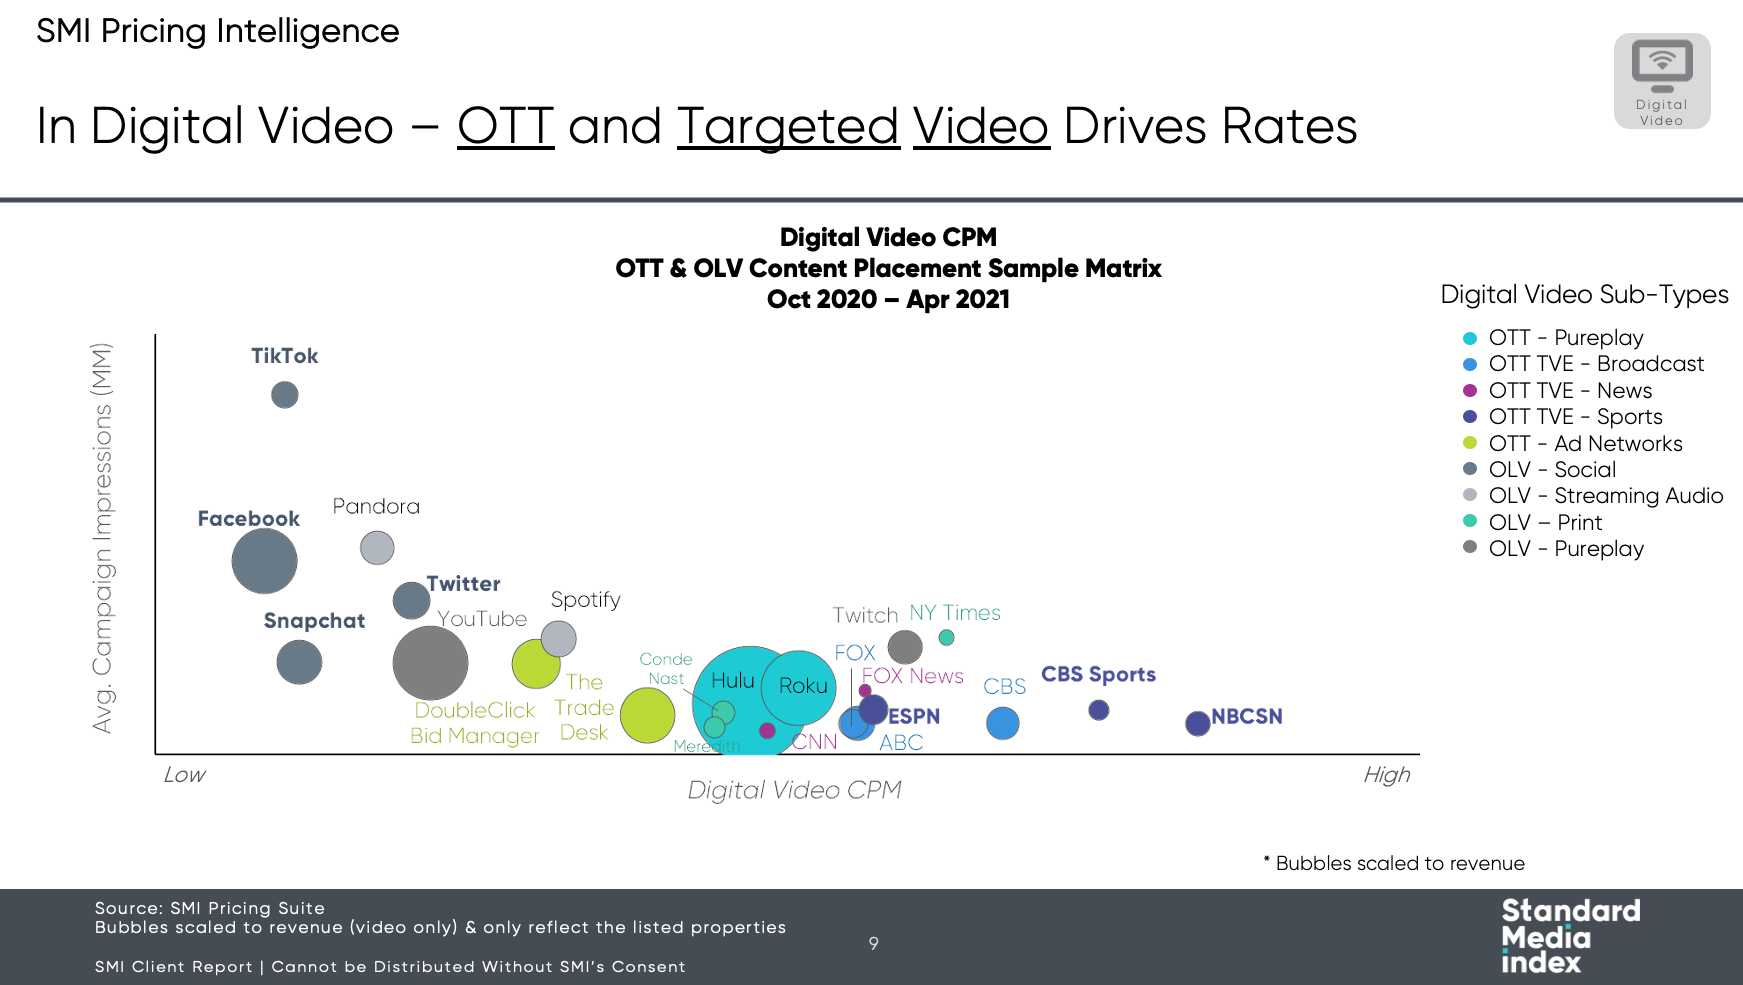
In particular, OTT and niche targeted video drive premium rates – consider the CBS Sports app, and market makers of OTT and connected TV (CTV), such as Hulu and Roku.
What our insight into agency bookings allows us to see is how much advertisers are actually paying — not rate card estimates, and not even what media companies report after the fact. We can see the “effective CPM” (eCPM) — where the CPM rate lands after audiences are delivered. By aligning SMI Pool expenditure with delivered audience to reach an eCPM, we can finally look at cross-screen video ad investments on the same basis of comparison, allowing planners, buyers and sellers to compare spend trends on equal footing. We have this insight now for video and increasingly for audio — currently terrestrial, with podcast to be delivered later this year.
It’s an exciting time to be in digital video. TV audiences, which include both linear and digital, are fragmenting, providing new opportunities across all media businesses. But the fragmentation also presents challenges in insights. By starting with actual agency booking data, we’re able to capture these insights, following advertising expenditure, and helping media buyers use our data for benchmarking.
We’re thrilled to note that SMI will be bringing our solutions to the UK market soon! Click here to learn more, or contact me directly here.


