National Ad Market Jumps 8% in February, Excluding Olympics
- Location
National TV Up 7.6% with Sports & Cable News Delivering All Gains
Standard Media Index, the only advertising intelligence firm to source detailed and complete data directly from the major agency holding groups, today unveiled national advertising revenue figures for February 2018. Excluding the Olympics, the total US national ad market grew by 8% in February 2018 compared to February 2017, driven by strong gains in National Television, Digital, and Radio. February year-to-date, the market is also up +8% when excluding the Olympics.
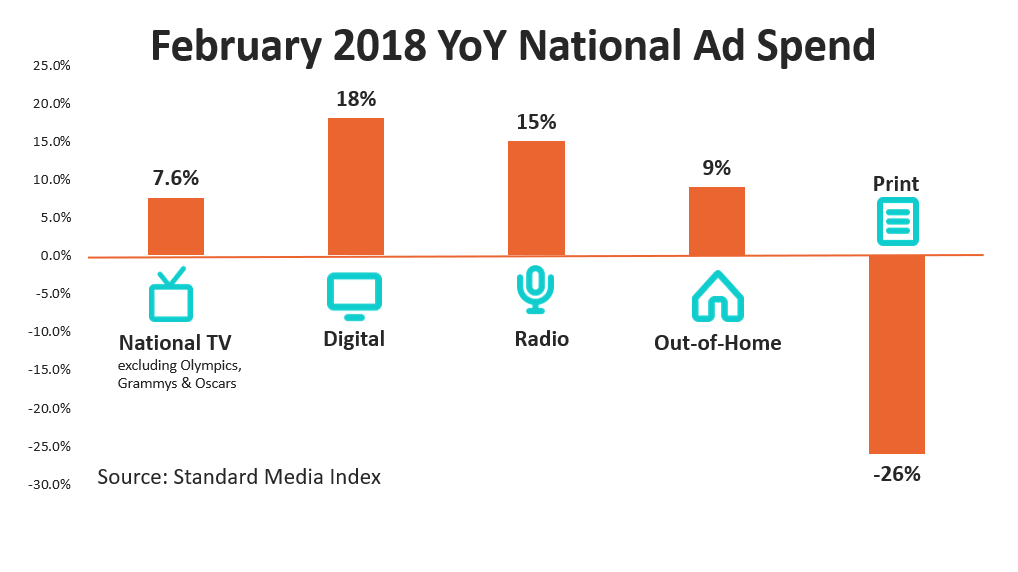
In February 2018, year-over-year (YoY) advertising revenue in National TV grew +12.0%, with an even +12% growth in Cable and +12% growth in Broadcast. Digital grew +18%, Radio increased +15%, Out-of-Home (OOH) grew +9%, and Print dropped -26%.
The National TV market in February is affected by the schedules of several major events, namely the Olympics, The Grammy Awards, and The Oscars. The Olympics increased February spend YoY, while those two award shows lowered the comparable spend. Both award shows took place in February 2017, while this year’s Grammy Awards took place in January and The Oscars took place in March. By taking out the Olympics, Oscars, and Grammys, the underlying YoY growth in February for National TV is +7.6%.
“February was a terrific month for National TV, even putting the success of Olympics to the side. The underlying jump of 7.6% was all down to the power of live Sports as the major broadcasters had big YoY falls in entertainment as they didn’t want to compete with NBC’s Olympics coverage.” says James Fennessy, SMI’s CEO. “We saw ESPN’s revenue jump significantly with big increases in the NBA, College Basketball and Sportscenter. FS1 also saw big gains in NASCAR and College Basketball and, to top it off, NBC’s Super Bowl slammed on $20 million more than last year’s event.”
Super Bowl
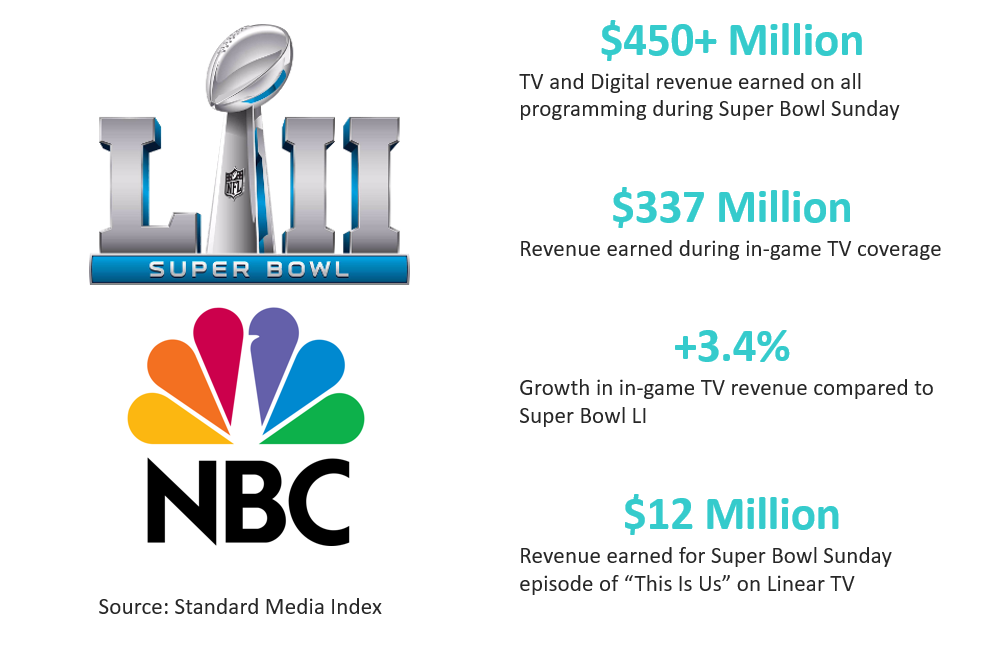
Super Bowl LII, which aired on NBC on February 4 th, generated in-game television revenue of $337 million, which was +3.4% higher than the game last year. Incorporating both linear TV and Digital, ad revenue for all Super Bowl programming was over $400 million. Meanwhile, the special airing of “This Is Us” after the Super Bowl generated more than $12 million dollars in television revenue – the highest amount that a single episode of the show has ever earned. Altogether, NBC earned more than $450 million for all TV programming and digital placements taking place on Super Bowl Sunday.
“The ability of live Sports to attract national advertisers was further reinforced with the great results NBC delivered in Super Bowl LII. While ratings fell 7%, revenue was up significantly and an average 30-second spot rose 3.8%. The move to run This Is Us following the Super Bowl was a masterstroke that achieved an extraordinary unit rate of almost $900k for a 30-second spot, which is more than double its already stellar rate,” says Fennessy.
Olympics
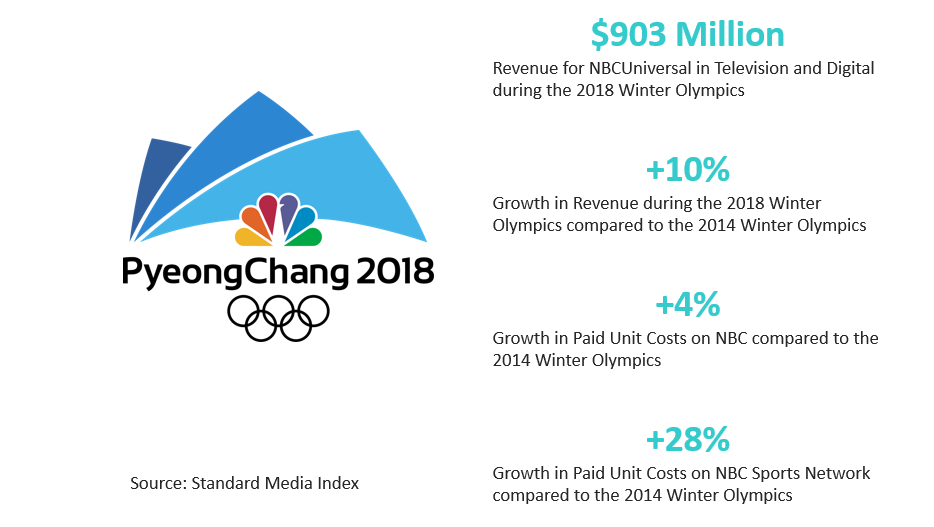
The 2018 Winter Olympics in Pyeongchang were a boon to NBC, bringing in $903 million of revenue across Television and Digital platforms, which is approximately +10% higher than the 2014 Winter Olympics in Sochi. This accounts for all ad revenue from February 8 thto the 25 th, since NBCUniversal aired pre-Olympic coverage including skiing and figure skating before the Opening Ceremony.
The bulk of the 2018 Olympic television programming took place on NBC and NBC Sports Network (NBCSN). NBCSN significantly increased the amount of coverage it aired, and as such, grew television Olympic ad revenue by more than 150% compared to the 2014 Games. The average paid cost of 30-second spot during the Olympics on NBC grew by +4% compared to the 2014 Winter Games, while the Paid Unit Cost on NBCSN grew +28%.
A smaller percentage of Olympic programming also aired on CNBC and USA Network. MSNBC did not air Olympic coverage this year as it had in the past.
Cable News
Cable News – which includes all programming across FOX News, CNN, MSNBC, CNBC, and HLN – continued its strong growth into February, with its ad revenue increasing by +13% year-over-year. MSNBC grew the most, rising +44%. CNBC also grew significantly at +39% year-over-year; however, that does include some Olympic programming. Ad revenue at the Big Three Cable News networks – FOX News, CNN, and MSNBC – increased +9.4% year-over-year.
Looking at weekday primetime programming, the paid costs for 30-second spot grew by double digits at each of the Big Three networks. FOX News grew +16%, CNN grew +19%, and MSNBC grew +37% YoY.
Upfront vs Scatter
The scatter market grew +13% compared to last February YoY. However, the share of dollars between Upfront and Scatter buys remains flat, with Scatter making up 27% of the gross revenue of all National Television in February. The gains in the Scatter market this month are attributed to the Olympics.
Digital
In February 2018, Digital increased +18% year-over-year. Digital platforms have grown ad revenue on a year-over-year basis in every month since Standard Media Index began tracking the data. Digital’s rate of growth slowed in the second half of 2017 and has remained steady in the low double digits since October. Spend on Digital now makes up 36% of the total national advertising market.
Social Media networks saw the largest growth in February at +47%. Pinterest increased ad revenue the most at +88%, followed by Facebook at +65%. Snapchat grew advertising revenue by +21%.
Digital Content Creators grew by +23% in February. Amazon earned the most advertising revenue, gaining +28%. Meanwhile, Complex Media more than doubled its revenue, increasing +115%.
February was a very strong month for digital advertising on TV Networks, with digital revenue increasing +44% YoY. NBCUniversal’s digital revenue, which included the Olympics, nearly tripled compared to February last year. Other big gainers were ESPN at +13% YoY and Viacom at +40%.
Internet Radio grew by +18% in February YoY. Pandora brought in the most advertising revenue, growing +5% compared to last February. Spotify, which is preparing for an IPO in the beginning of April, saw revenues grow by +63%. Meanwhile, iHeartMedia, which filed for bankruptcy on March 15, lost -5% of its revenue in February.
Advertisers by Category
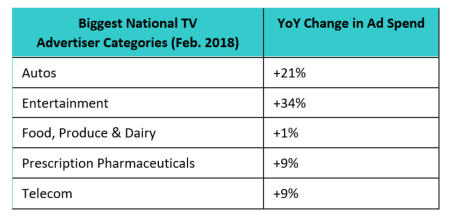
Looking at advertiser categories across National TV, each of the top five categories increased spend compared to last year. The Auto industry was once again the largest spender this month, growing +21%. That is followed by Entertainment which grew +34%, Food, Produce & Dairy (+1%), Prescription Pharmaceuticals (+9%), and Telcom (+9%).
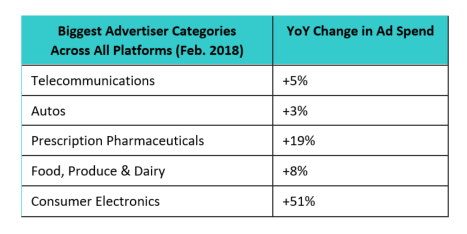
Looking at advertiser categories across all platforms, each of the top five categories increased spend compared to last year. The Telecommunications industry was the largest spender in February, increasing +5% year-over-year. That is followed by Autos, which gained +5%, then Prescription Pharmaceuticals (+19%), Food, Produce & Dairy (+8%). Rounding out the top five largest categories is Consumer Electronics, which doubled its advertising spend in February 2018 YoY.