SMI Core data captures the actual spend data from the SMI Pool partners of major holding companies and large independent agencies, representing up to 95% of all US national brand ad spending, to provide a complete monthly view of the SMI Pool market size, investment share and category performance. Core Data delivers detailed ad intelligence across all media types, including Television, OTT, Digital, Out of Home, Print, and Radio.

Topline Insights

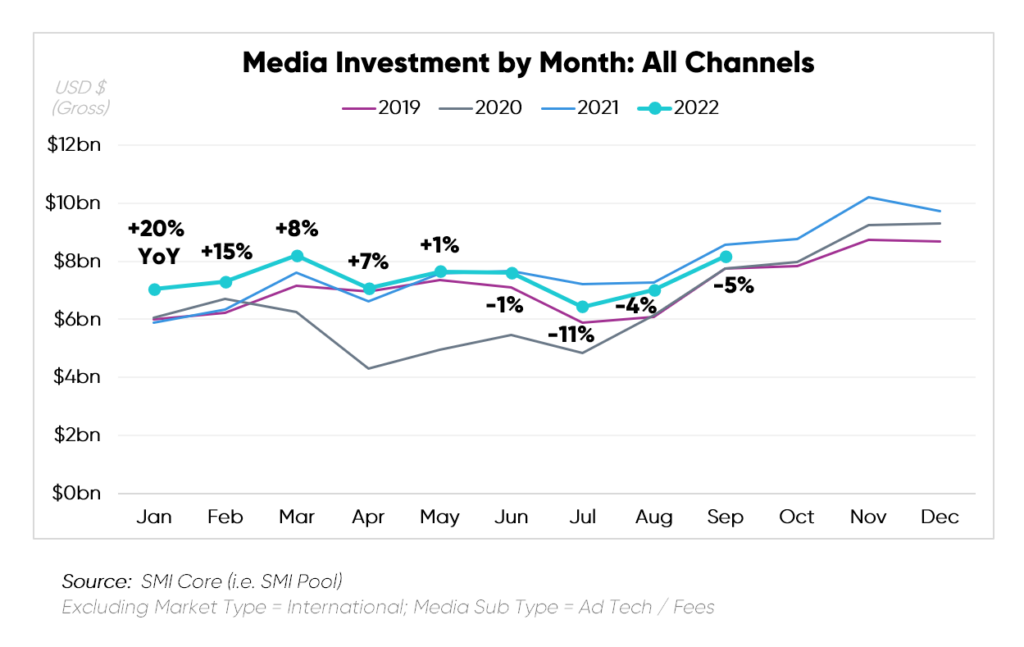
Advertising investment continued to recede for the fourth consecutive month, -5% during September 2022 vs. the previous year.
The Q4 holiday season will remain a crucial time to determine if the market can turn around from the recent decline trend.
Insights by Media Type

Q3 2022
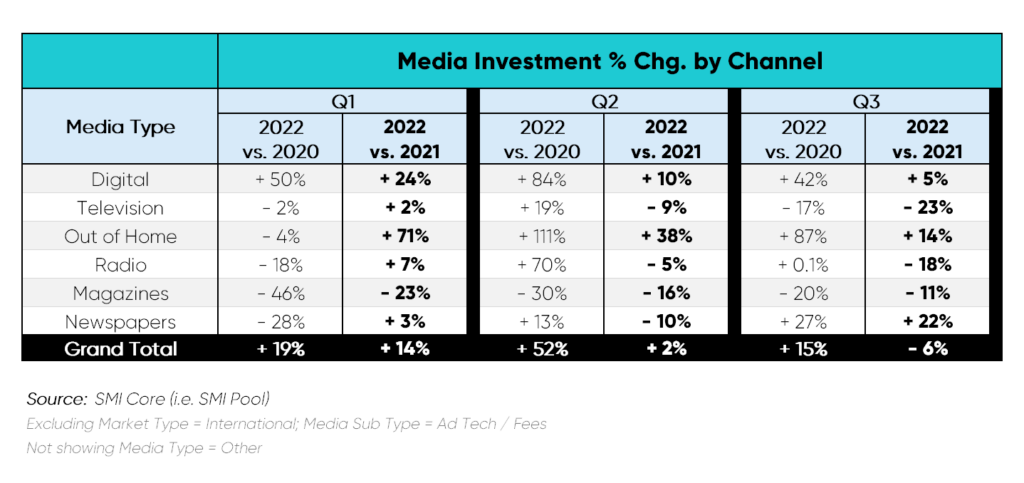
Digital moved to represent two-thirds share of ad dollars, roughly $13.2bn during Q3 2022.
Sports investment decreased, leaving Linear Television with the deepest cuts this quarter. The absence of the Summer Olympics in July and a portion of August impacted total spending for Q3.
Newspaper investment growth sped up during Q3 2022 vs. 2021, surpassing Out-of-Home and Digital which remained the fastest growing Media Types since Q3 2021.
Insights by Media Owner

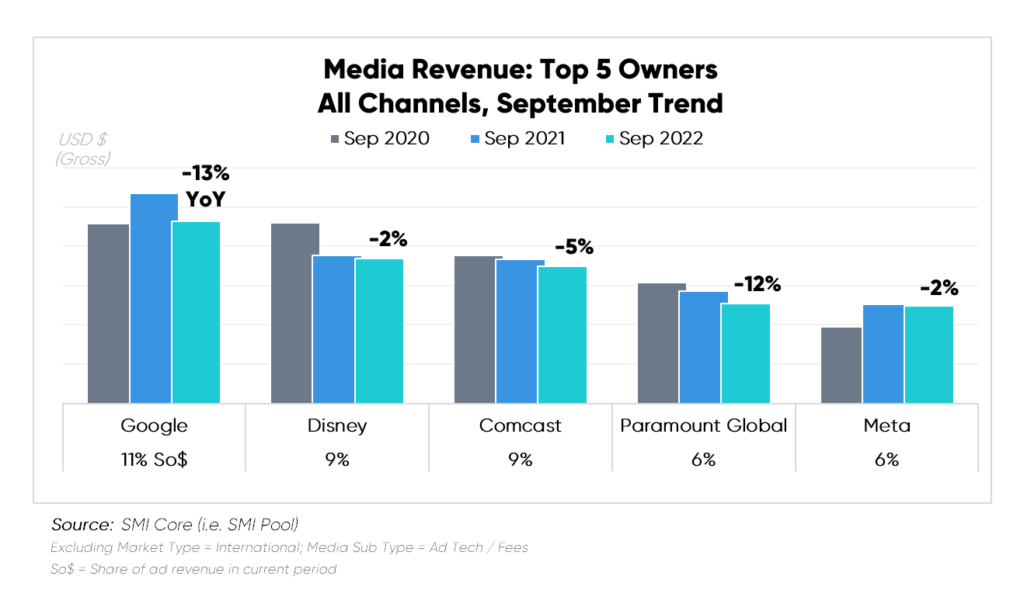
Declines in ad revenue touched each of the top five media companies, with Disney and Meta faring better than the others in the set during September 2022.
Cable TV receded by $284MM, a key detractor for top Media Owners in the traditional space. Similarly, Search fell by more than $147MM, impacting Google’s performance.
While Disney, Comcast, and Paramount encountered YoY fallout in September for the last few years, Google and Meta newly ventured into negative territory for the month.
Insights by Product Category Group

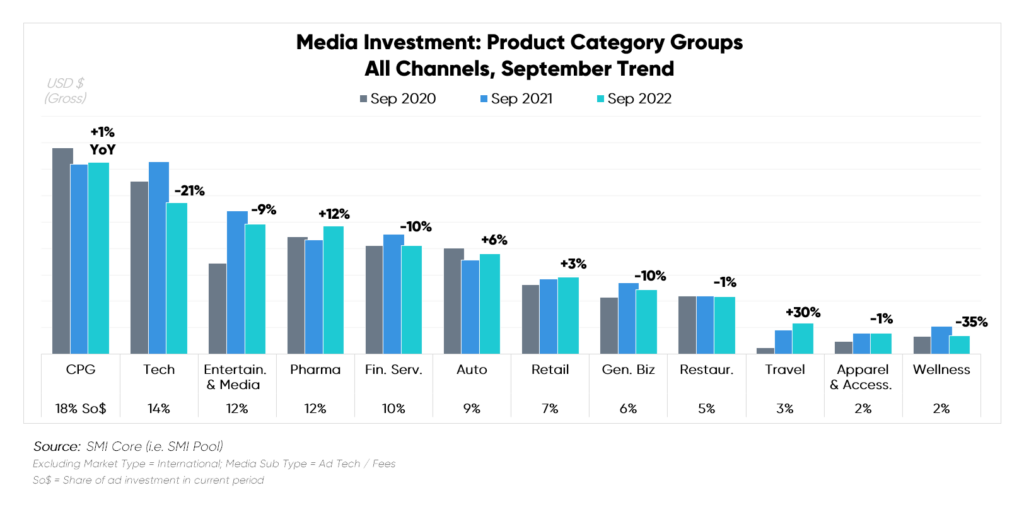
Ad spending within Pharma, Retail and Travel Category Groups rose to a new high for the month, while many other categories experienced decreases:
- Pharma beefed up spending by more than +$104MM, allocating the majority share of ad dollars to Digital Media outlets.
- Auto expanded for the first time in September, since 2017 (+7% YoY), breaking a four-year downturn.
- Seven out of twelve Product Category Groups newly experienced pull-back during the period, indicating a broad slowdown.


