SMI Core data captures the actual spend data from the SMI Pool partners of major holding companies and large independent agencies, representing up to 95% of all US national brand ad spending, to provide a complete monthly view of the SMI Pool market size, investment share and category performance. Core Data delivers detailed ad intelligence across all media types, including Television, OTT, Digital, Out of Home, Print, and Radio.
Topline Insights
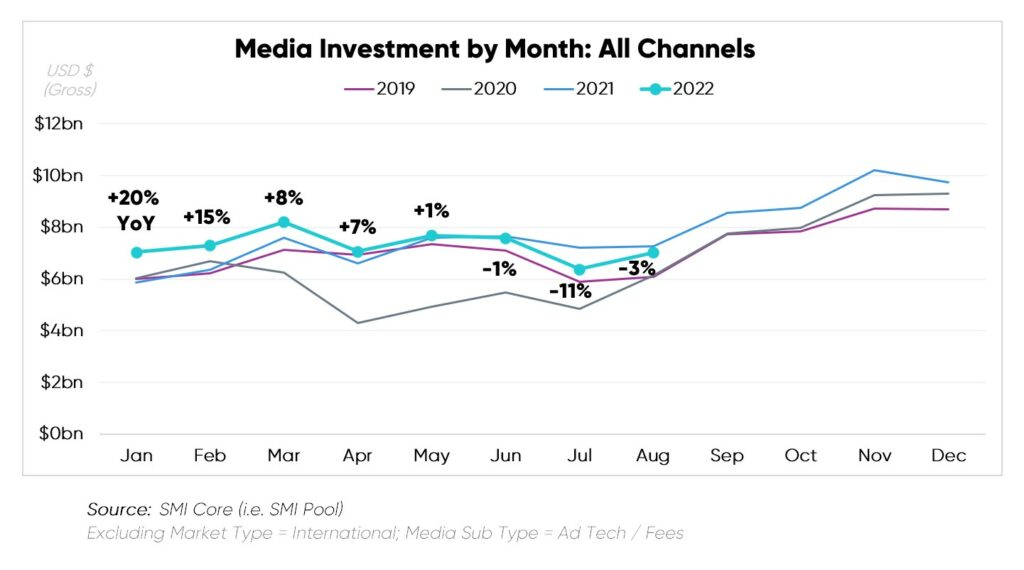
Advertising expenditure contracted -3% during August 2022 vs. 2021, showcasing the continued impact of absent Olympics dollars on Linear TV.
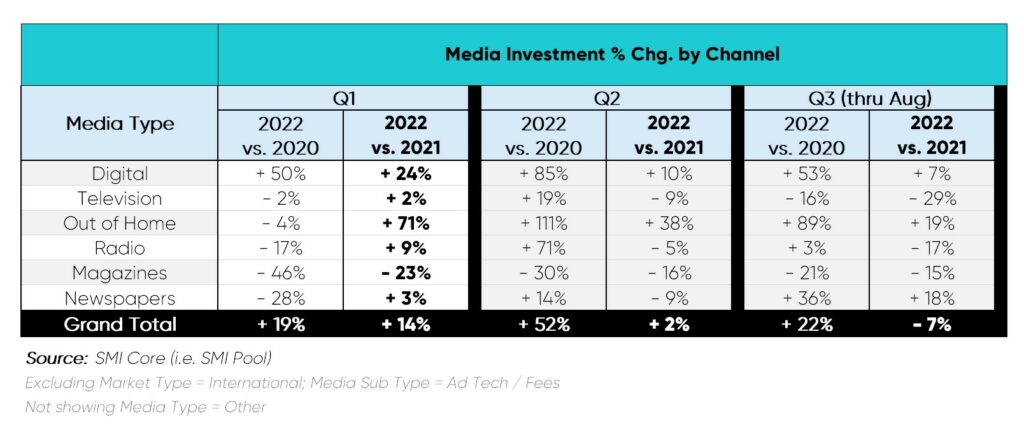
Major media channels trended in the same direction in July YoY & August YoY, excluding Newspapers which moved from flat to double-digit lift.
August’s -3% YoY performance marked improvement vs. July’s -11% YoY rate which featured absent Olympics dollars in tandem with absent NBA Finals dollars.
When stripping out the carriers of these major events respectively in July and August, the SMI Pool increased investment by +2% to +3% YoY, indicating market stability fueled by Digital interest.
Insights by Media Type
Preliminary Q3 2022 (thru August)
Among the leading channels, Digital climbed to the best Q3-to-date on record, newly representing two-thirds of advertising dollars. Meanwhile, Linear Television experienced the deepest cuts at -29%, amid dark Olympic & NBA Finals programming.
Out-of-home continued to rise at the fastest rate during the Preliminary Q3 2022 period YoY, making strong strides back to 2019 spend levels.
Newspapers also expanded thus far in the quarter, as people continue to return to the office and revert back to previous commuting routines.
- Advertiser interest spanned Local (+63%) & National (+11%) titles alike to reach consumers.
Insights by Media Owner
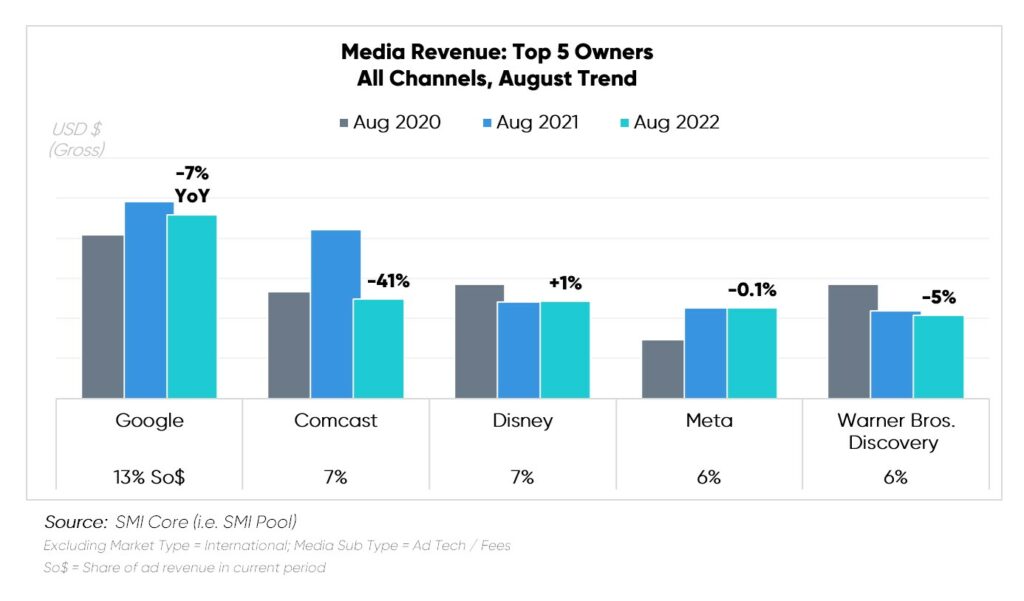
Among the top companies, only Disney ad revenue expanded during August 2022, at a light +1% rate YoY. Traditional media remained 60% of said ad revenue.
Aside from the sharp declines felt across Comcast, resulting from changes in Sports programming, the other top companies displayed smaller dips in revenue vs. August 2021:
- Both Google and Meta revenues declined as Entertainment & Media spending fell sharply. (e.g., Motion Pictures, Pre-recorded Media Content)
- Warner Bros. Discovery received significant pull-back via Financial Services (-30%) and CPG (-9%), two of its top contributing ad sectors.
Insights by Product Category Group
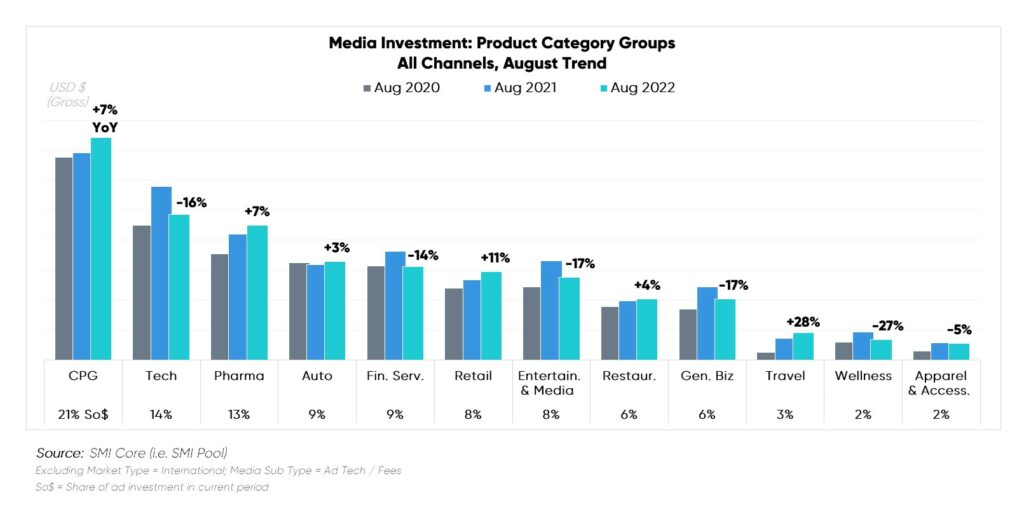
In August 2022, CPG, Pharma, Retail and Travel Category Groups performed at peak levels, while Auto newly expanded:
- CPG held on as the #1 Category Group, with $1.5bn in ad investment.
- Travel remained the fastest growing Category Group; however, the growth rate has slowed considerably compared to August 2021’s clamor (+175%).
- Although Auto reached a three-year high, August 2022 numbers as one of the lowest ad spend months on record in the pool data set, dating back to 2017.
- July 2022 landed similarly, with only the first four months of Covid seeing more ad spend fallout.