National Advertising Market Gains 10% in July
- Location
Standard Media Index, the only advertising intelligence firm to source detailed and complete data directly from the major agency holding groups, unveiled national advertising revenue figures for July 2018. The National Advertising market gained 10% YoY, when factoring out the World Cup.
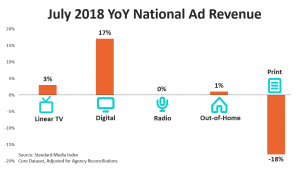
Looking across platforms, Digital was the strongest performer this quarter, growing 17%. That was followed by National TV at 3% (excluding the World Cup), Out-of-Home at 1%, Radio flat, and Print at -18%.
NATIONAL TELEVISION RESULTS
National Television increased in July, thanks to Cable programming, which rose 5% YoY, while Broadcast fell -1%, when excluding the World Cup from both.
The 3% rise in revenue coincided with an 2% increase in the number of 30-second spots. While paid unit costs dipped, that was offset by a -16% reduction in the number of unpaid spots – also known as makegoods or ADUs.
“The decline in ADUs is a positive sign for the industry, indicating that programs are delivering the expected audience figures this month,” said James Fennessy, CEO of Standard Media Index. “National TV declined in the previous three months (April – June), and it’s encouraging to see this trend reverse towards growth.”
In July, the Upfront market grew 5%, while the Scatter market grew 1%.
ENTERTAINMENT
Entertainment Television revenue increased 3% YoY in July with Primetime Original Programming up 8%. MI defines original programming as non-syndicated, new episodes for comedy, drama, and reality subgenres. Three of the major broadcast networks gained revenue from Primetime Original Programming this month: NBC at 8%, ABC at 18%, and CBS at 21%. FOX, which aired the World Cup Tournament through much of July, saw a decline in revenue from Primetime Originals that coincided with a decline in spots for this programming.
Two-thirds of the revenue from Primetime Originals in July was from the Reality subgrenre. Primetime Original Reality shows grew 3%, as revenue from ABC’s “The Bachelorette” and NBC’s “America’s Got Talent” increased 35% and 42% respectively.
Looking at market share for all Entertainment programming except Kids, Comcast Corp. was the largest TV network group by Entertainment revenue in July at 19%. That’s followed by Discovery, Inc (including Scripps Network Interactive, which it acquired in March) at 17%, Viacom, Inc at 14%, Time Warner, Inc at 11%, CBS Corp. at 8%, The Walt Disney Co. at 8%, A&E Television Networks at 7%, and 21st Century Fox at 5%. It’s a highly consolidated market where the top eight media owners, all with at least 5% market share, account for 88% of ad revenue. The top 12 media owners account for 98% of ad revenue.
NEWS
Cable News continues to be a boon for National TV in July. The five cable news networks – FOX News, CNN, MSNBC, CNBC, and HLN – grew a combined 18% YoY for the month. Among the networks, MSNBC has been a powerhouse, growing 44% YoY. Nevertheless, FOX News continues to charge the highest prices for spots during new episodes
Meanwhile, Broadcast News was positive in July, marking the first month of YoY gains in 2018 for the genre. Combined, ABC, NBC, and CBS grew revenue from news programming by 8% in July
Among TV Network Groups, Comcast has 35% share in news, followed by 21st Century FOX at 16%, The Walt Disney Co. at 16%, Time Warner at 16%, and CBS at 8%.
SPORTS
Revenue from Sports increased 20% in July YoY, although that is entirely due to the World Cup. When excluding the tournament, Sports revenue is down -6%.
Looking at the full World Cup Tournament, which ran from June 14 to July 15, in-game revenue is down -29% from the 2014 games. Breaking that down, the English-language version, which aired FOX and FS1, is down -18% despite an 85% increase in the number of 30-second spots. Meanwhile, the Spanish-language version, which aired on Telemundo, is down -36% as the number of spots fell -26%.
Among TV Network Groups, The Walt Disney Co. has 33% share in sports, followed by Comcast at 33%, 21st Century FOX at 23% and CBS at 3%.
ADVERTISERS BY CATEGORY
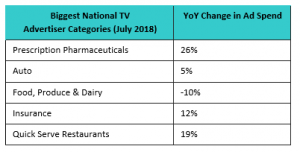
Across National TV, the Prescription Pharmaceutical industry spent the most on advertising this month, growing 26% YoY. Rounding out the top five were: Auto (5%), Food, Produce & Dairy (-10%), Insurance (12%), and Quick Serve Restaurants (19%)
The retail industry was uncharacteristically spending on advertising in July. While July is considered “off-season” for retail, all three retail subcategories – department stores, specialty retailers, and other (online & convenience) retailers – overspent historical norms. This is a partial response to favorable economic conditions allowing retailers to open their open their wallets to attract more customers. Altogether, the combined retail category increased spend compared to last July by 16%.
Looking at advertiser categories across all platforms – including TV, Digital, Radio, Out-of-Home, and Print – the top four categories increased spend compared to July last year. The Telecommunications industry was the largest spender in July, increasing 5% year-over-year. That is followed by Auto (22%), Prescription Pharmaceuticals (37%), Quick Serve Restaurants (51%), and Food, Produce & Dairy (-2%).
ABOUT STANDARD MEDIA INDEX
Standard Media Index is an advertising intelligence company helping media companies and investment managers determine ad revenue streams, pricing and planning models, and competitive benchmark analysis. SMI provides the actual ad spend and unit costs so clients can tackle high-stakes decisions with confidence. SMI sources data directly from agency invoicing systems for the most accurate and granular view into the media ecosystem. Headquartered in New York, with offices in Sydney, Madrid and London, companies across the world turn to SMI to reveal hidden opportunities and help drive better results. For more information and resources visit www.standardmediaindex.com or join the conversation on Twitter and LinkedIn.
METHODOLOGY
SMI sources our data from the raw spend from the media agency holding groups to see the actual dollar amounts spent on each ad buy. We work with 5 of the 7 major media holding groups – making up 70% of the national TV market – and model out the remaining 30% using occurrence data. Market share percentages only include TV networks within our Pool of data.
For more information or questions about the data, please contact:
Jennifer Rose, Senior PR Manager
jrose@www.standardmediaindex.com, +1 (646) 432-9447