National Advertising Market Gains 5% in Q2
- Location
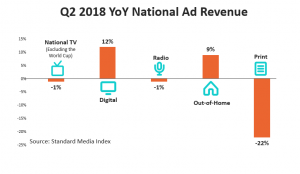
Standard Media Index, the only advertising intelligence firm to source detailed and complete data directly from the major agency holding groups, unveiled national advertising revenue figures for the second quarter of the year (April – June). The National Advertising market gained 5% in Q2, despite a modest decline in National TV when factoring out the World Cup.
Looking across platforms, Digital was the strongest performer this quarter, growing 12%. That was followed Out-of-Home at 9%, National TV at -1%, Radio at -1%, and Print at -22%.
Q2 NATIONAL TELEVISION RESULTS
National Television revenue declined in Q2 as the average paid unit cost for 30-second commercial fell -3.4%. That is partially offset by a 2.5% increase in the number of 30-second spots to 3.4 Million and a -4% reduction in the number of unpaid spots – also known as makegoods or ADUs.
“As Upfront Season comes to a close, the industry now needs to quickly move its attention to the Scatter market,” says James Fennessy, CEO of Standard Media Index. “In Q2, revenue from the Scatter market grew by 11% YoY while revenue from Upfronts fell -4% and Direct Response advertising remained flat.”
This quarter, eight TV Network groups had market share of 5% or higher by revenue. Among them, 21stCentury FOX grew the most, gaining 9% revenue. That’s followed by Time Warner, Inc at 8% revenue growth and Comcast at 6%.
ENTERTAINMENT
Entertainment Television revenue was flat in Q2 at -0.4% but grew in Primetime Original Programming. Specifically, Dramas were up 0.9%, Reality shows were up 2.5%, and Comedies were up 19.5%. SMI defines original programming as non-syndicated, new episodes for those three subgenres. All four major broadcast networks gained revenue from Primetime Original Programming this quarter: CBS at 22%, ABC at 7%, NBC at 2%, and FOX at 2%.
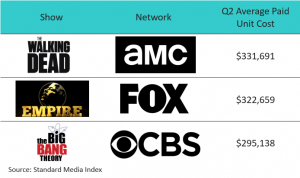
Among Primetime Originals, AMC’s “The Walking Dead” charged the most for a 30-second commercial at $331,691 in Q2. That’s followed by FOX’s “Empire” at $322,659, and CBS’ “The Big Bang Theory” at $295,138.
The weather wasn’t the only thing heating up this May and June. Q2 also marked the start of the summer season, and with that, the premieres of several talent competition programs. Along with the new season of NBC’s “America’s Got Talent,” came NBC’s “World of Dance,” FOX’s “So You Think You Can Dance?” and FOX’s “The Four: Battle for Stardom.” In June alone, new episodes of those four shows earned a combined $76.9 Million.
Looking at market share, Comcast Corp. was the largest TV network group by Entertainment revenue in Q2 at 19%. That’s followed by Discovery, Inc (including Scripps Network Interactive, which it acquired in March) at 15%, Viacom, Inc at 14%, Time Warner, Inc at 10%, CBS Corp. at 9%, The Walt Disney Co. at 9%, A&E Television Networks at 7%, and 21st Century Fox at 6%. It’s a highly consolidated market where the top eight media owners, all with greater than 5% market share, account for 88% of ad revenue. The top 12 media owners account for 98% of ad revenue.
NEWS
Cable News continues to be a boon for National TV in Q2. The five cable news networks – FOX News, CNN, MSNBC, CNBC, and HLN – grew a combined 16% YoY for the quarter. Among the networks, MSNBC has been a powerhouse, growing 70% YoY.
Meanwhile, Broadcast News is down -6% in Q2. In fact, the genre has lost revenue every month so far in 2018. Among the Big Four Broadcast Networks, only CBS and ABC increased news revenue in Q2 by 4% and 2% respectively.
Among TV Network Groups, Comcast has 35% share in news, followed by 21st Century FOX at 17%, The Walt Disney Co. at 16%, Time Warner at 15%, and CBS at 10%.
SPORTS
Revenue from Sports fell -6.6% in Q2 YoY when excluding the World Cup. Sports revenue saw significant losses from changes in basketball schedules – both at the professional and college level. This year’s NBA Finals only lasted four games compared to five last year, causing the series to earn -12% less revenue YoY. However, when looking at average revenue per game, this year was up 10%, having brought in $45.7 Million per game for ABC.
Similarly, NCAA Basketball earned less than half of what it did last year in Q2 due to the March Madness schedule. In 2017, the two Final Four Semifinal games took place in April; meanwhile, those two same games took place in March of this year. When equivalizing for both the NCAA Basketball games, as well as the World Cup, Sports is only down -1% in Q2.
Looking at World Cup revenue for June only, English-language live games were broadcast by both FOX and FOX Sports 1 (FS1). The total revenue for June on the combined FOX stations was $58.2 Million, which is a 31% decline from the 2014 games that aired on ABC-owned networks. Among Spanish-language broadcasts, the 2018 World Cup earned $90.3 Million in June for NBCUniversal’s Telemundo compared to $135.5 Million for Univision in 2014. However, it is important to note that four additional games took place in June 2014 than they did this year.
“The growth in average revenue per-game for the NBA Finals highlights the opportunity for highly-anticipated sports events to drive revenue,” says Fennessy. “By the same token, the declines for the World Cup, without the US in the tournament, illustrates the risk that TV Networks take when it comes to punting on expensive sports rights.”
Among TV Network Groups, The Walt Disney Co. has 41% share in sports, followed by Comcast at 21%, Time Warner at 17%, 21st Century FOX at 13% and CBS at 2%.
ADVERTISERS BY CATEGORY
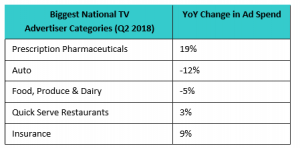
Across National TV, the Prescription Pharmaceutical industry spent the most on advertising this quarter, growing 19% YoY. The industry increased spend in Entertainment by 25% and News by 14% while decreasing on Sports by 28%. Rounding out the top five were: Autos (-12%), Food, Produce & Dairy (-5%), Quick Serve Restaurants (3%), and Insurance (9%).
Looking at advertiser categories across all platforms, each of the top five categories increased spend compared to last year. The Telecommunications industry was the largest spender in Q2, increasing 2% year-over-year. That is followed by Autos (10%), Prescription Pharmaceuticals (17%), Quick Serve Restaurants (23%), and Specialty Retailers (1%).
ABOUT STANDARD MEDIA INDEX
Standard Media Index is an advertising intelligence company helping media companies and investment managers determine ad revenue streams, pricing and planning models, and competitive benchmark analysis. SMI provides the actual ad spend and unit costs so clients can tackle high-stakes decisions with confidence. SMI sources data directly from agency invoicing systems for the most accurate and granular view into the media ecosystem. Headquartered in New York, with offices in Sydney, Madrid and London, companies across the world turn to SMI to reveal hidden opportunities and help drive better results. For more information and resources visit www.standardmediaindex.com or join the conversation on Twitterand LinkedIn.
METHODOLOGY
SMI sources our data from the raw spend from the media agency holding groups to see the actual dollar amounts spent on each ad buy. We work with 5 of the 7 major media holding groups – making up 70% of the national TV market – and model out the remaining 30% using occurrence data. Market share percentages only include TV networks within our Pool of data.