National Advertising Market Gains 7% in October
- Location
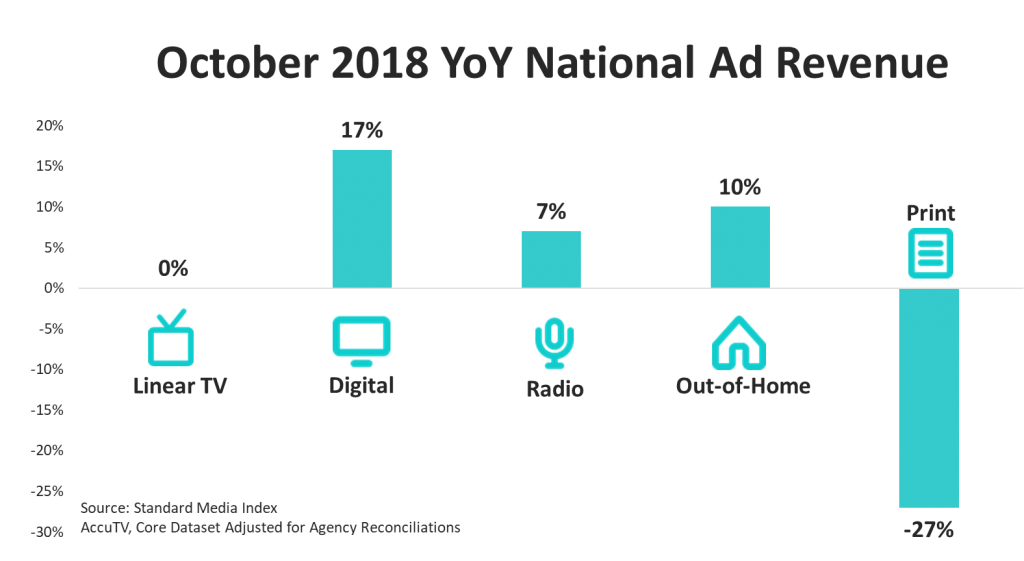
Standard Media Index, the most trusted source of ad pricing and revenue data, announced that the national advertising marketplace grew 7% in October year-over-year (YoY).
Looking across platforms, Digital was the strongest performer this month, growing 17%. That was followed by Out-of-Home (OOH) at 10%, Radio at 7%, Television flat, and Print at -27%.
National Television Results
National Television was flat in October with Broadcast down -7% and Cable up 5%. Broadcast revenue tumbled as NFL games dropped the ball this year. Broadcast networks did trend positively in News and in Primetime Original Entertainment verticals. Additionally, Broadcast networks increased their amount of 30-second commercial spots by 5% YoY. Among those, the percentage of spots that were unpaid – also known as makegoods or ADUs – fell by six percentage points. Nevertheless, these adjustments weren’t enough to make up for the losses in NFL revenue.
Meanwhile, Cable networks increased revenue by 5% YoY, even as commercial spots remained flat. Cable News has held steadfast for the year, and it remained the fastest-growing vertical this month.
The Upfront market grew 2% in October. Meanwhile, the Scatter market fell -4% year-over-year as marketers moved to Upfront buys to avoid Scatter premiums.
“The linear television season has started sluggishly as expectations of robust demand haven’t yet materialized in the market,” said James Fennessy, CEO of Standard Media Index. “Demand from marketers continues to outpace audience erosion even if that is due to more limited digital video advertising options due to ad-free delivery.”
Entertainment
Primetime Original Programming revenue increased 3% YoY in October, as the 2018-19 season began to heat up. SMI defines original programming as non-syndicated, new episodes for comedy, drama, and reality subgenres. Among primetime originals, dramas grew the most in October at 7% YoY. Several freshman dramas were among the highest grossing this month, namely ABC’s A Million Little Things, FOX’s 9-1-1, and NBC’s Manifest and New Amsterdam.
When including the last week in September, during which many shows began the season, the average price for a 30-second commercial spot during a primetime original entertainment program remained flat from last year. It’s noteworthy, however, that the average price paid during regular season episodes rose 6%, while the average prices during premiere episodes fell -1%. Still, advertisers paid an average premium of 158% to advertise during a season premiere.
Looking at market share for all Entertainment programming except Kids, Comcast Corp. was the largest TV network group by Entertainment revenue in October at 18%. That’s followed by Discovery at 14%, Viacom at 11%, The Walt Disney Co. at 10%, CBS Corp. at 8%, Time Warner at 8%, 21st Century FOX at 6%, A&E Television Networks at 5%, and AMC Networks at 4%. It’s a highly consolidated market where the top eight media owners account for 86% of Entertainment ad revenue. The top 12 media owners account for 94% of ad revenue.
News
Cable News continued to be National TV’s leading genre in ad revenue in October. The six cable news networks – FOX News, CNN, MSNBC, CNBC, HLN, and FOX Business – grew a combined 14% YoY during the month. Among the networks, MSNBC was the top performer, growing 30% YoY.
Additionally, Broadcast News was positive in October, rising 2%. ABC grew the most among English-language networks, rising 13% YoY. On the Spanish-language side, Univision and Telemundo increased ad revenue in their News divisions by 25% and 31% respectively.
Sports
October was a tough month for live sporting events, as the NFL fumbled its television revenue. Part of the decline resulted from 27 games in October this year compared to 31 games this month last year. Combining September and October, the NFL aired 51 games in both 2017 and 2018. In the two-month period, NFL revenue fell -19%, as the number of 30-second commercial spots fell -6%.
“The effects of the lower audiences last year are spilling into this season, as NFL revenue is down,” said Fennessy. “Nevertheless, as the market reports improving viewership, we will see how these trends change over the remaining months of the season.”
On the other hand, the 2018 World Series hit it out of the park. The series, which aired on FOX, increased paid unit rates by 15% YoY. Altogether, FOX caught $121.6 Million in ad revenue. With 5 games this year, compared to 7 games in 2017, the average revenue per game was up 27%.
Advertisers by Category
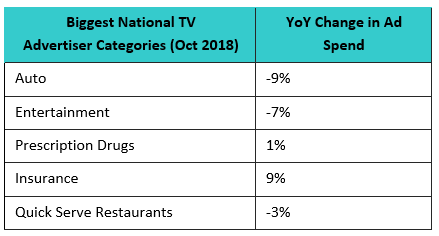
Across National TV, the Auto industry spent the most on advertising this month, although that spend is down -9% YoY. Rounding out the top five were: Entertainment (-7%), Prescription Drugs (1%), Insurance (9%), and Quick Serve Restaurants (-3%).
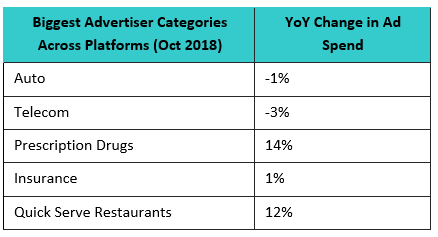
Looking at advertiser categories across all platforms – including TV, Digital, Radio, Out-of-Home, and Print – Autos remain the largest spender of the month, although only decreasing -1% YoY. That is followed by Telecom (-3%), Prescription Drugs (14%), Insurance (1%), and QSR (12%).
About Standard Media Index
Standard Media Index is the most trusted source of advertising pricing and spend data in the marketplace. SMI accesses actual agency spend from the world’s largest media buying groups, as well as leading independents, and then organizes that data to create a clear, granular, and easy-to-use database for our clients and agency partners. By aggregating this data, which accounts for 70%+ of all agency spend, SMI offers detailed ad intelligence across all media types, including Television, Digital, Out-of-Home, Print, and Radio. Data can be broken down by ad types, publishers, product categories, and other dimensions. Our data supports insights covering 32 countries around the world. For more information and resources visit www.standardmediaindex.com.
Methodology
SMI sources our data from the raw spend from the media agency holding groups to see the actual dollar amounts spent on each ad buy. We work with 5 of the 7 major media holding groups and leading independents – making up 70% of the National TV market. Using SMI real prices paid on spots and combining that with occurrence data from Nielsen Ad Intel, SMI models out the full 100% of the spots in the TV marketplace within Nielsen’s coverage. Market share percentages are comprised of the approximately 130 national TV networks we measure.
