Strong Scatter, Cable and Broadcast News Numbers Credited for Upward Tick
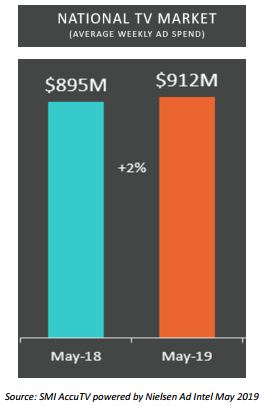
NEW YORK, NY – June 27, 2019 – Standard Media Index, the most trusted source of advertising pricing and spend data in the marketplace, today reported that the National TV market continues to rebound with a 2% increase year-over-year in terms of average weekly ad spend from $895M to $912M in the month of May. “We continue to see strengthening conditions in the second quarter for the National TV market after a soft first quarter, even factoring in the Olympics inflated annual comparison. In fact, May 2019 has delivered its strongest seasonally adjusted result since we began measurement. This reinforces the continued power of National TV and is in line with results being achieved in recent Upfront negotiations,” said James Fennessy, Standard Media Index CEO.
NBCU led the pack in the National TV market in May. NBCU grabbed 18.7% share of the total marketplace, followed closely by Disney with 16%, Warner with 12.1%, Discovery with 11.9% and CBS with 9.7%.
As with all things TV, timing plays a crucial role. The CBS result was boosted by the finale of The Big Bang Theory, the network’s ratings juggernaut, which ended this year after 279 episodes as the fictional science community flocked to the screens to wish goodbye. This finale delivered a 27% increase year-over-year in May.
In May, broadcast entertainment was up 1.6%, driven by The Big Bang Theory on CBS, which delivered $22M out of $38M overall net growth across National TV. The show on CBS and TBS combined brought in $63M in total. Next was NBC’s The Voice at $50M which was down 10% year-over-year.
Meanwhile, the cable entertainment market increased by 2.6% in May with HGTV, Food Network and Bravo leading that growth with more original content.
The scatter marketplace remained healthy in May, driven by the 2019 PGA Championship game, the famed golf tournament that moved from August to May on CBS. That telecast alone accounted for a third of the net growth of scatter revenue.
A look at top owners by genre shares revealed that NBCU topped entertainment with 17% followed by Disney at 16%, Viacom at 13%, Disney at 11% and CBS with 10% in May.
In the news vertical, NBCU led with 30% with Fox at 18%, Disney at 17%, Warner at 14% and CBS with 12% for the month. In cable news (CNN, FOX News, and MSNBC) revenues are softening as the networks pumped more ADUs into the market to offset under delivery of guaranteed audiences. There was a 110% increase in ADUs on a year-over-year basis.
For the sport genre, Disney took the lions share with 37% followed by Warner with 25%, NBCU at 19% and CBS with 7%. Overall sport was up 5% for the broadcast month of May, driven by the 2019 NBA Basketball Playoffs, as there were two more games in May this year versus last year, and the move of the PGA Championship to May.
“We are seeing D2C brands are the major catalyst for growth in National TV, especially those in the apparel and wellness categories,” Fennessy said. He added, “We know the networks see this as a major opportunity and are very focused on engaging with these advertisers as they look to build brand equity through the quality reach National TV is uniquely positioned to deliver.”
About Standard Media Index
Standard Media Index is the most trusted source of advertising pricing and spend data in the marketplace. SMI accesses actual agency spend from the world’s largest media buying groups, as well as leading independents, and then organizes that data to create a clear, granular, and easy-to-use database for our clients and agency partners. By aggregating this data, which accounts for 70%+ of all agency spend, SMI offers detailed ad intelligence across all media types, including Television, Digital, Out-of-Home, Print, and Radio. Data can be broken down by ad types, publishers, product categories, and other dimensions. Our data supports insights covering 32 countries around the world. For more information and resources visit www.standardmediaindex.com.
Methodology
SMI sources our data from the raw spend from the media agency holding groups to see the actual dollar amounts spent on each ad buy. We work with 5 of the 7 major media holding groups and leading independents – making up 70% of the National TV market. Using SMI real prices paid on spots and combining that with occurrence data from Nielsen Ad Intel, SMI models out the full 100% of the spots in the TV marketplace within Nielsen’s coverage. Market share percentages are comprised of the approximately 130 National TV networks we measure.