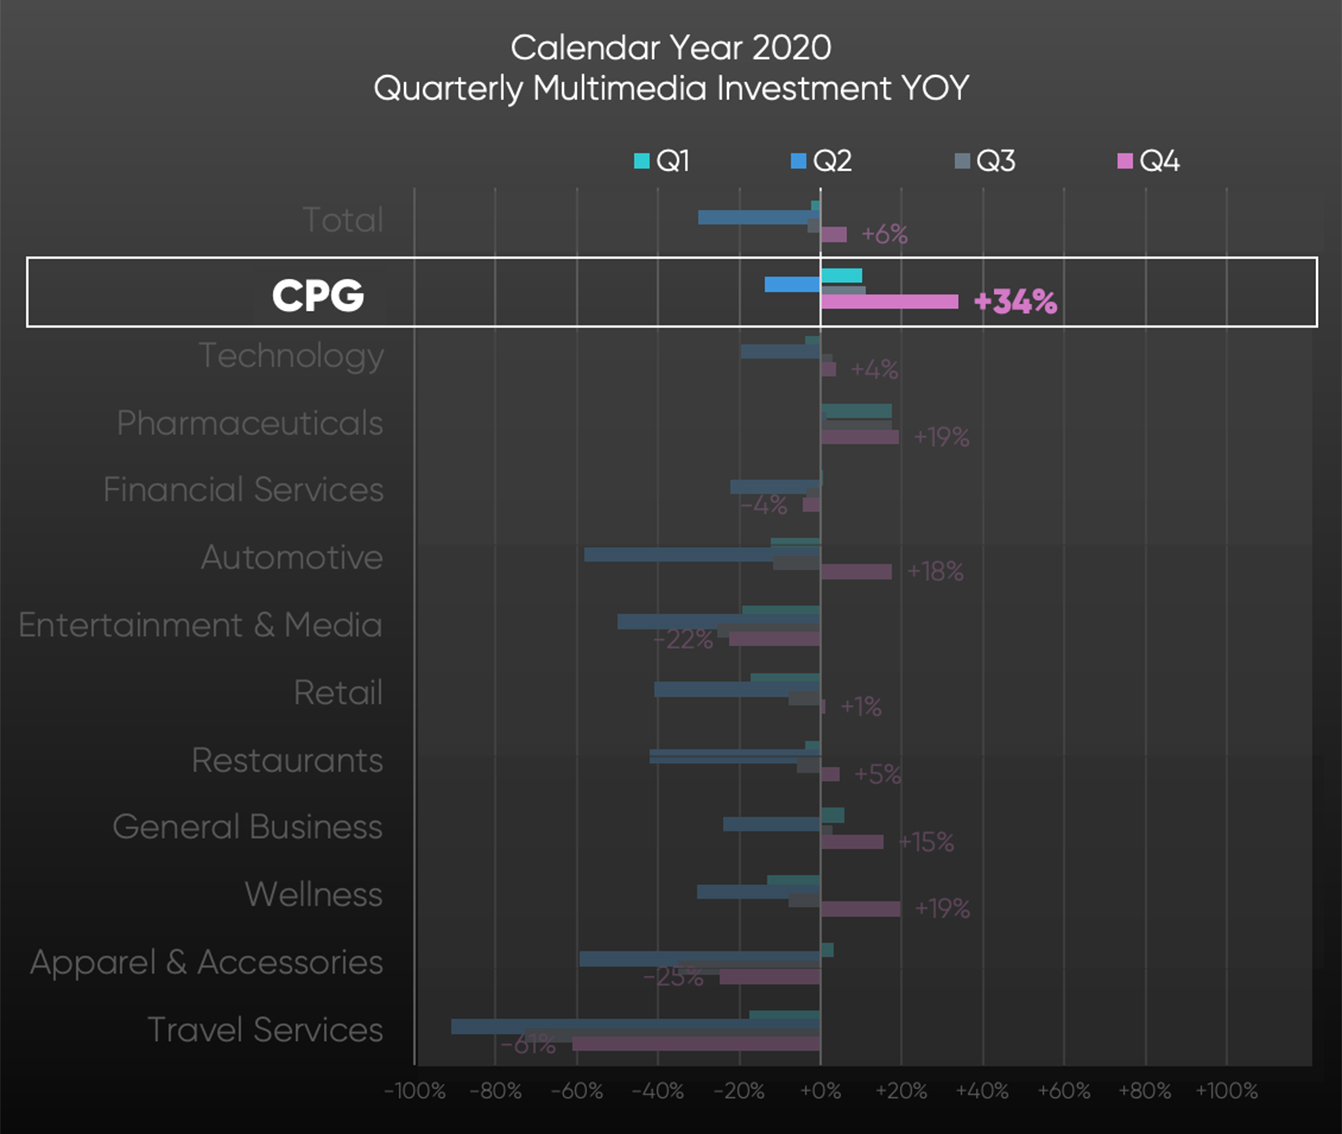
After a dismal second quarter 2020, the national ad marketplace ended with a strong fourth quarter. SMI reported no category was stronger in the final quarter than Consumer Packaged Goods, with year-over-year ad spend growth of +34%, the most of any vertical. For calendar year 2020, CPG ad spend grew +10%, compared to -7% for the entire ad market.
CPG ended calendar 2020 +10% vs 2019, while leading Q4 with impressive +34% growth.
Ad spend growth was across all five CPG subcategories; food, personal care, household supplies, alcoholic beverages and non-alcoholic beverages. CPG marketers continued to increase ad dollars to digital media which had significant increases. Additionally, with the return of live sports and strong ratings from news, investment increased for national TV in fourth quarter.
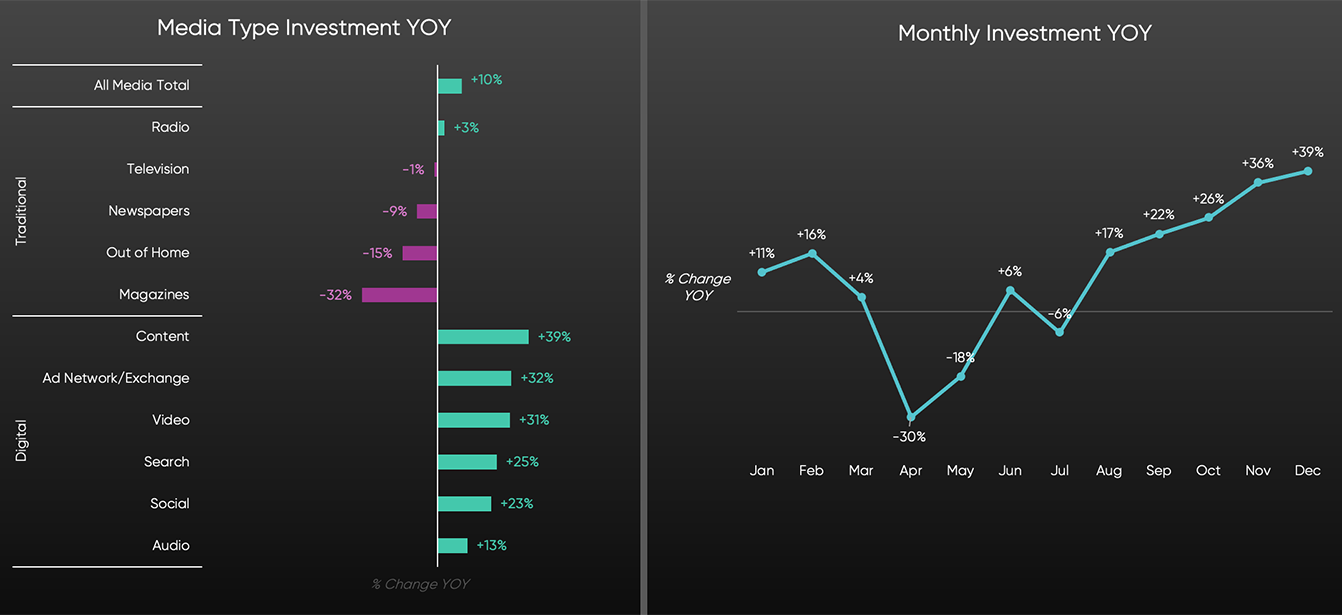
On a monthly basis, national advertising by CPG, bottomed out in April, at -30%. Since then, ad spend began to slowly rebound. By August, the category was year-over-year +17% and with steady monthly growth reached +39% in December.
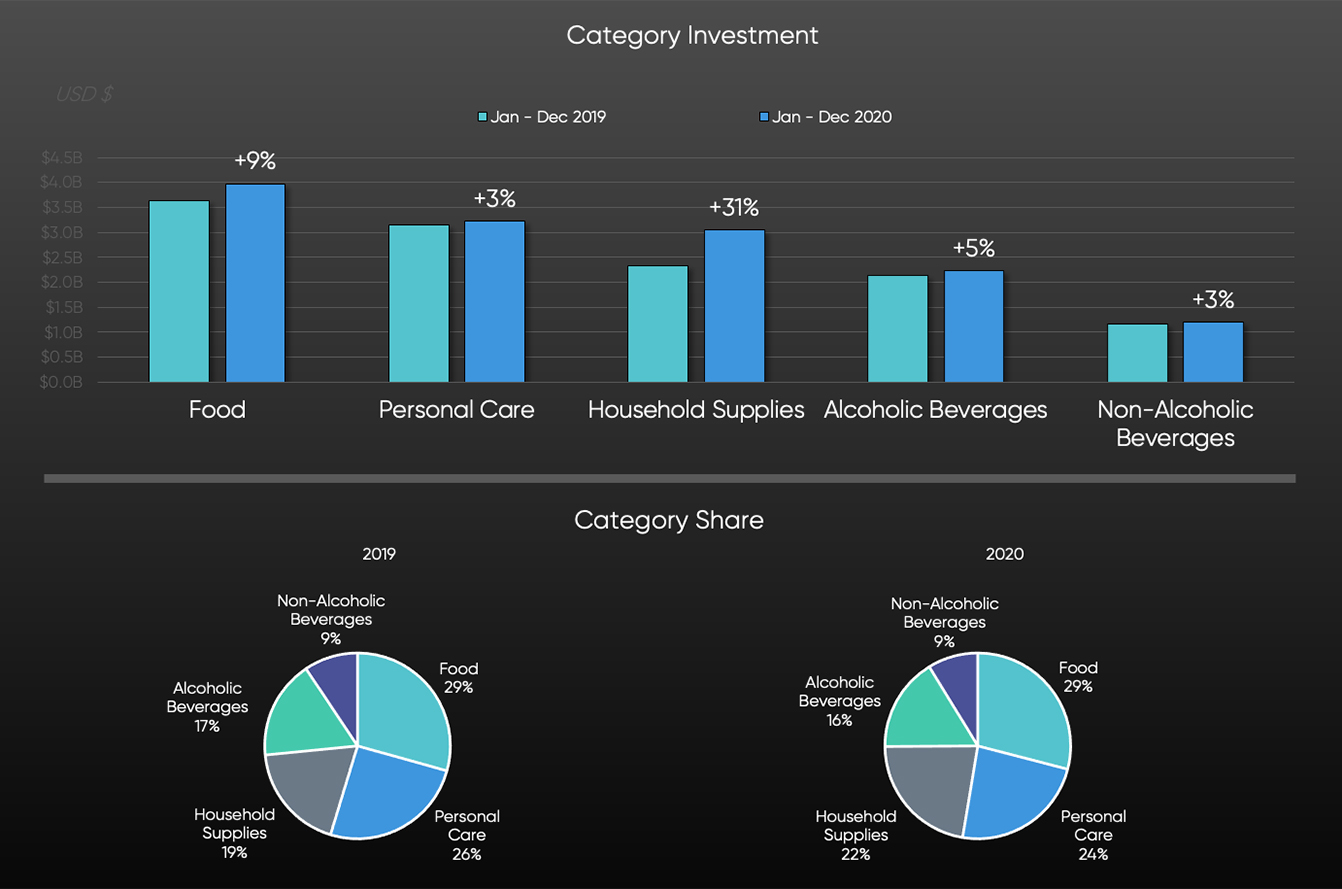
For the calendar year 2020, ad spend for all CPG subcategories reported year-over-year increases. With many stay-at-home orders in place, advertising for household supplies in 2020 was +31%, the most of any subcategory. In 2020, household supplies accounted for 22% of all CPG advertising investment (up from 19% in 2019), still ranking third among subcategories.
Overall, year-over-year TV investment by the category dropped by -1% in 2020. The primary reason was upfront ad dollars which declined by -8%. The scatter market and DR both with notably smaller ad commitments, reported growth of +7% and +30% respectively. National TV ad spend in the first six months of 2020 was -12%, but bounced back to +4% in the second half. News accounting for just 7% of total national TV ad dollars was the only program type with a year-over-increase (+4%).
CPG subcategories
With a share of 29% of CPG ad spend, food is the largest subcategory. In 2020 ad dollars grew by +9%, fueling the growth was digital. The increase was led by delivery services; Amazon, Walmart and Instacart all ranked in the Top 5 in ad share growth. Out-of-home ad spend was +26%.
In 2020, personal care ad dollars were +3%. The growth came entirely from digital media. Spurring the increases were iHeart streaming audio with nearly a fourfold increase in dollars. Social media dollars were +35% with notable growth coming from Snapchat, Pinterest and TikTok.
Advertising support for household supplies was +31%, fueled by percent-double gains across all digital platforms, led by ad network/exchange at +77%. With traditional media, radio reported a significant increase in ad spend at +187%.
Ad investment supporting alcoholic beverages was +5%. The increases were attributed to digital with year-over-year percent double-digit gains across most platforms. Conversely, all traditional media segments had percent double-digit declines. Ad spend growth was strongest in the fourth quarter as sports returned and the holidays.
Non-alcoholic beverages, reported an ad spend increase of +3%, with strong growth in digital media, most notably from Hulu which reached parity with YouTube in online video ad share as well as Vevo (+424%). Ad spend growth was greatest in October with year-over-year of +75%.
Overall, the strong ad investment by Consumer Packaged Goods in the fourth quarter bodes well heading into 2021.
Connect with us today if you’d like to receive the full CPG category investment report.
Complete and submit the form below and we will be in touch soon.


