Upfronts Pricing Trends: Cable pricing leads YoY increases in TV eCPMs leading into Upfront season
It’s that time of year again: Upfronts! The linear TV annual rate negotiations between agencies and major TV networks is getting underway in earnest this season, so SMI offers this index to show the rate of change in pricing of TV eCPMs over the first five months of the last three broadcast calendars (starting each October).
Note, the eCPMs, or “delivered CPMs” (i.e. paid unit costs for ad spots adjusted by the subsequent TV ratings) are not the same as the “negotiated CPMs” or “planned CPMs” (more the theoretical value of the TV audiences for negotiation purposes, well before the airings), which are the real subject of Upfront negotiations. But inasmuch as negotiated CPMs are intended to become eCPMs, we expect this index can be useful to buyers and sellers.
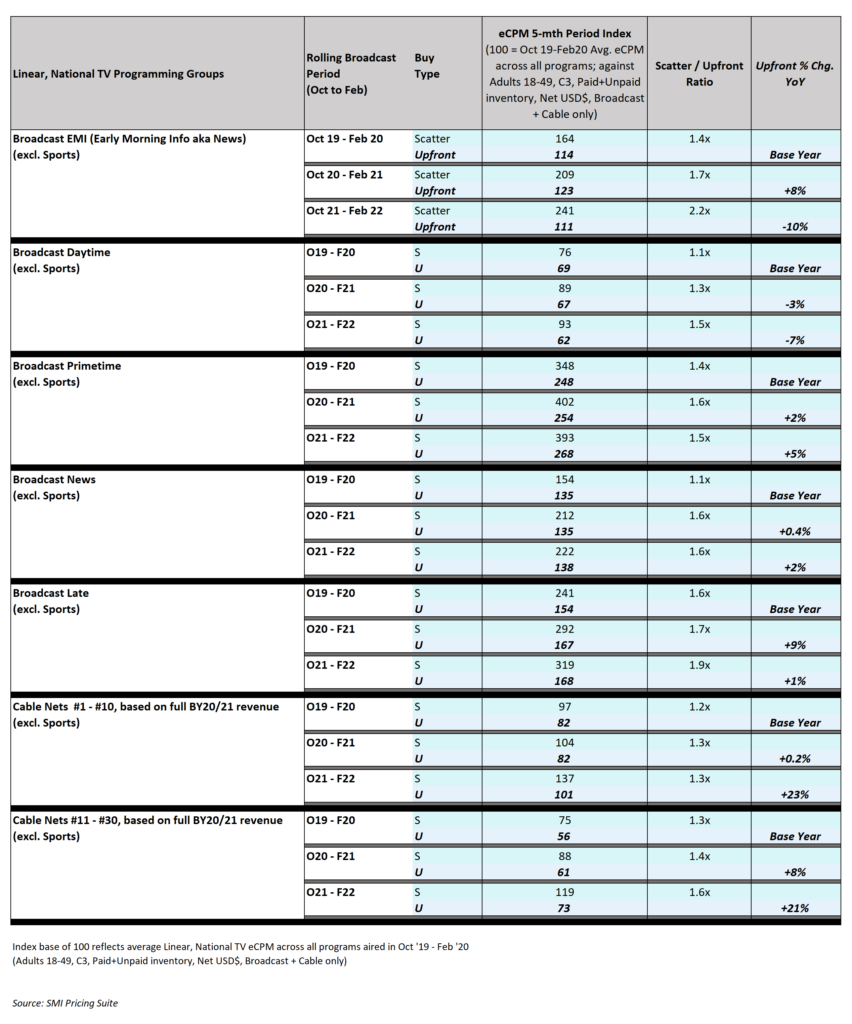
The eCPM Index shown in the forth column of the chart are blinded averages pegged as 100 to the average eCPM for broadcast and cable combined for the period of Oct. ’19-Feb ’20 (i.e. the equivalent first five months of the broadcast calendar that we have to compare to the current partial broadcast calendar). The Scatter/Upfront Ratio indicates the premium paid by the market for the roughly 1/3 of national linear TV inventory not bought during the Upfronts but rather on the more liquid Scatter market.
The Upfronts YoY column shows the rate at which eCPMs have increased for Upfront inventory in the past two years (for the same five-month period).
Cable inventory, which despite its lower CPMs constitutes about 2/3 of national linear TV spending, was up by more than 20% for the top 50 networks at the start of this broadcast calendar compared to the prior year’s Upfront period.
This analysis excludes sports inventory. That and the actual CPMs that are blinded by this index are available to SMI customers; ask your rep.
