U.S. SMI Core Release Note – April 2022
SMI Core data captures the actual spend data from the SMI Pool partners of major holding companies and large independent agencies, representing up to 95% of all US national brand ad spending, to provide a complete monthly view of the SMI Pool market size, investment share and category performance. Core Data delivers detailed ad intelligence across all media types, including Television, OTT, Digital, Out of Home, Print, and Radio.

Core Release
April 2022
Topline Insights
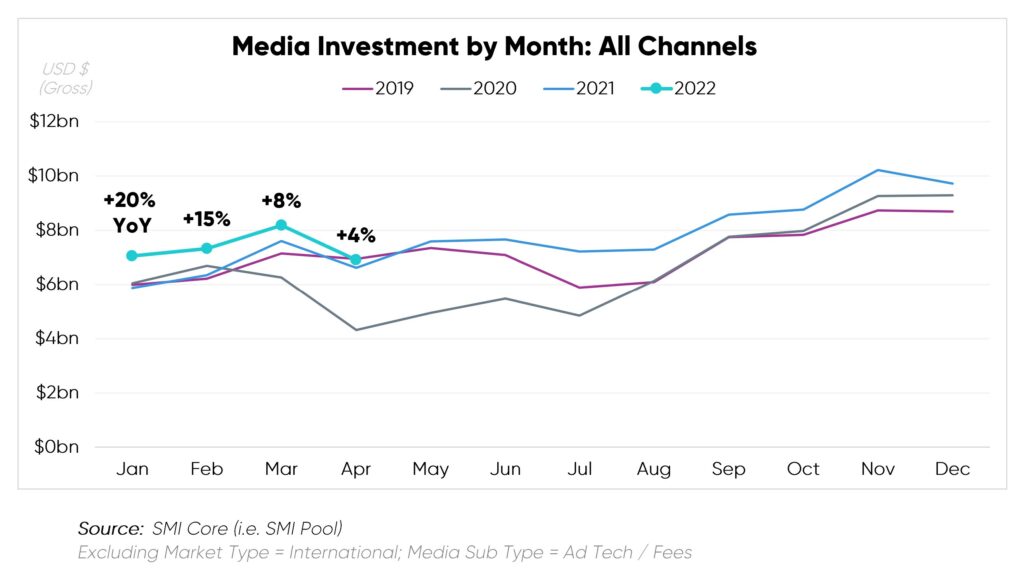 April 2022 ad spend fell -1% shy of April 2019, three years ago, which remains the strongest April on record (according to SMI Core which dates back to 2017).
Compared to April 2021, Digital carried market growth along with sharply rebounding OOH.
Notably, however, April had the weakest YoY monthly growth to date in 2022. While January 2022 expenditure expanded +20% across all channels YoY, the growth rate subsided to +4% in April, compared to last year. (It should be noted that +4% YoY growth for the entire market would have been in the realm of “normal,” back in pre-pandemic times.)
 April 2022
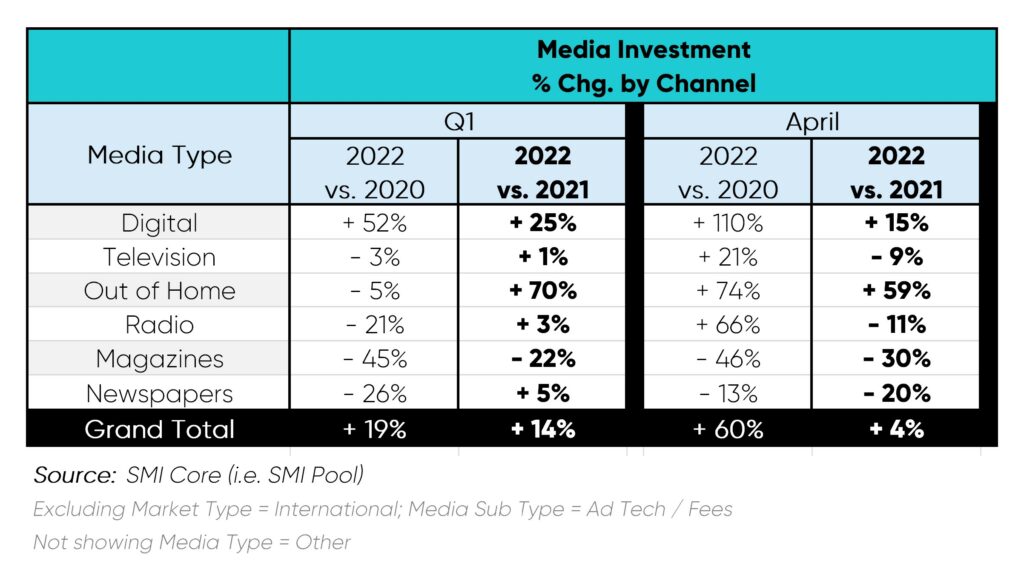
Digital Media saw the strongest growth in the market for the month. April 2022 had the strongest digital ad spend on record. Accordingly, Digital Media’s share of the ad mix jumped +5pts to 56% in April.
Notably, the YoY ad spend lift has slowed, relative to earlier 2022 months. While April reached +15% vs. April 2021, earlier Q1 months ranged from +23% to +28% YoY.
Linear TV spending receded -9% this April vs. last year. Auto and CPG advertisers had the greatest pull-back, totaling over -$150MM.
OOH began Q2 with the greatest percentage growth across Media Types. Entertainment & Media and Technology remained the top two streams of ad revenue for Out-of-Home.
Insights by Media Owner
 This month’s data release reflects recent mergers in the Present Master Owner field. For example, such updated naming conventions include:
- Paramount Global (formerly ViacomCBS)
- Warner Bros. Discovery (formerly Warner Media and Discovery, Inc.)
- TelevisaUnivision (formerly Grupo Televisa and Univision)
- about.com (formerly Dotdash)
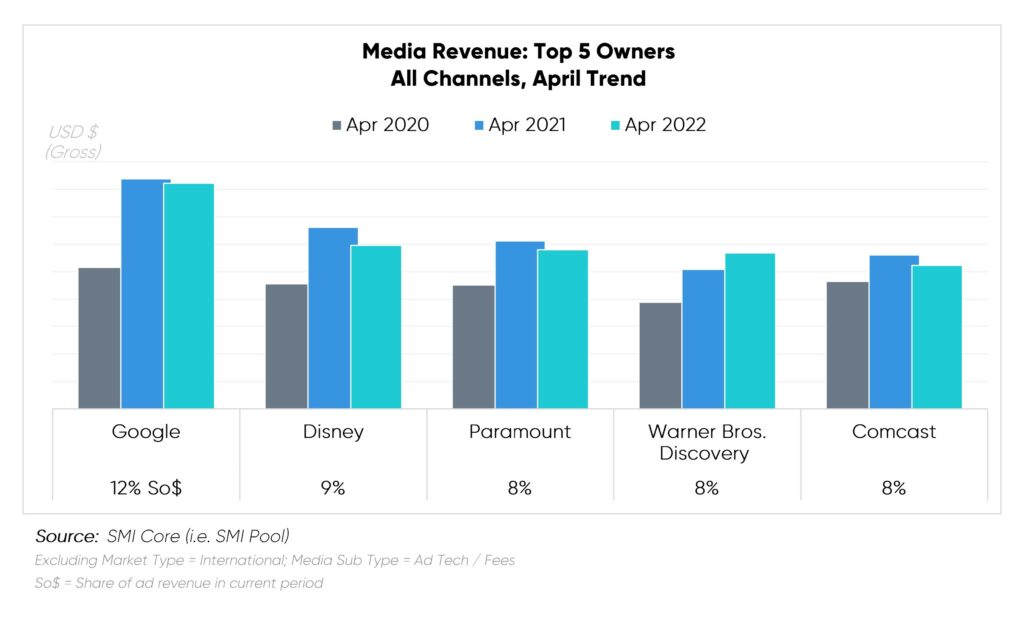
Google posted a slight -2% reduction in ad revenue for the month but maintained the top spot with a 12% share of advertising dollars. Top Google investors, the Technology and Auto sectors cut back this month.
Disney held the #2 spot in April. As with most of the top five, ad revenue slightly deflated. However, Disney’s Digital revenue was at an all-time high in April. Notably, Digital went from representing 23% of Disney’s ad revenue in April 2020 to 32% in April 2022.
Warner Bros. Discovery, the only top player to increase ad revenue YoY, expanded +12% vs. Apr 2021. Technology and Financial Services beefed up investment, leading incremental dollars spent with the owner.
Insights by Product Category Group
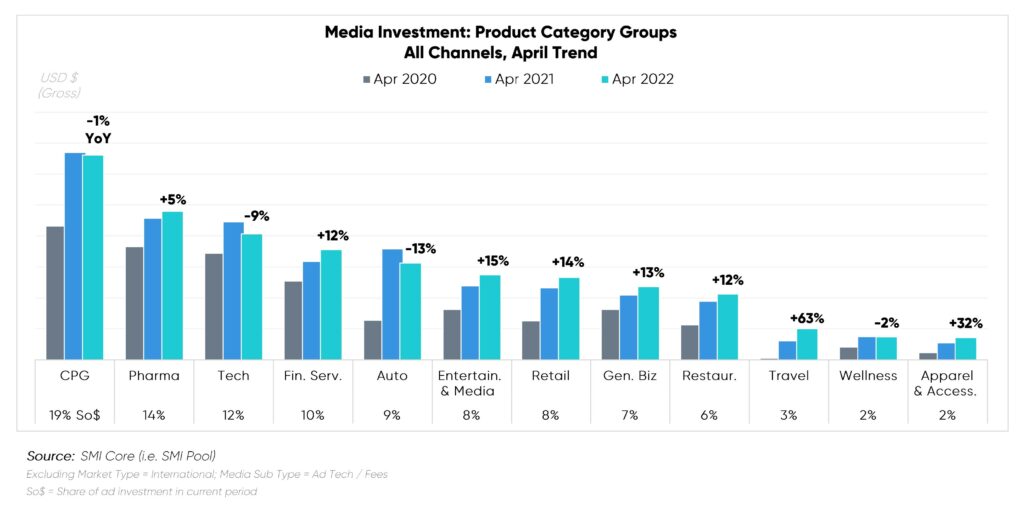 The top five Category Groups remained the same vs. April 2021. The ranking shuffled: Financial Services overtook Automotive, while the Top 3 remained in order. Both Automotive and Technology notably lost investment share pts (-2%), leading scale-back among all reported sectors.
Travel stood out with both the highest investment volume increase and YoY percent growth, driving the top investment share gain (+1pt). Cruise Lines surged 8x over the previous year.
When assessing Media Type x Category Group, Digital represented the common touchpoint driving growth. Such leaders included Banking and Investments, General Services, Personal Care, Prescription Drugs, and Entertainment.
Conversely, Linear TV divestment caused most of the ad spend YoY drop in April. Primary sources for this trend included Auto Vehicle & Dealerships, Insurance, Tech, Prescription Drugs, and Food.
