I was asked this month to share some AVOD and OTT insights at the Global – Future of TV Forum. As you know, OTT consumption has been growing with new platforms and with more premium video content available. And consumer adoption, especially during the pandemic, grew considerably. As a result, advertisers are allocating more of their ad budget on this fast-growing medium.
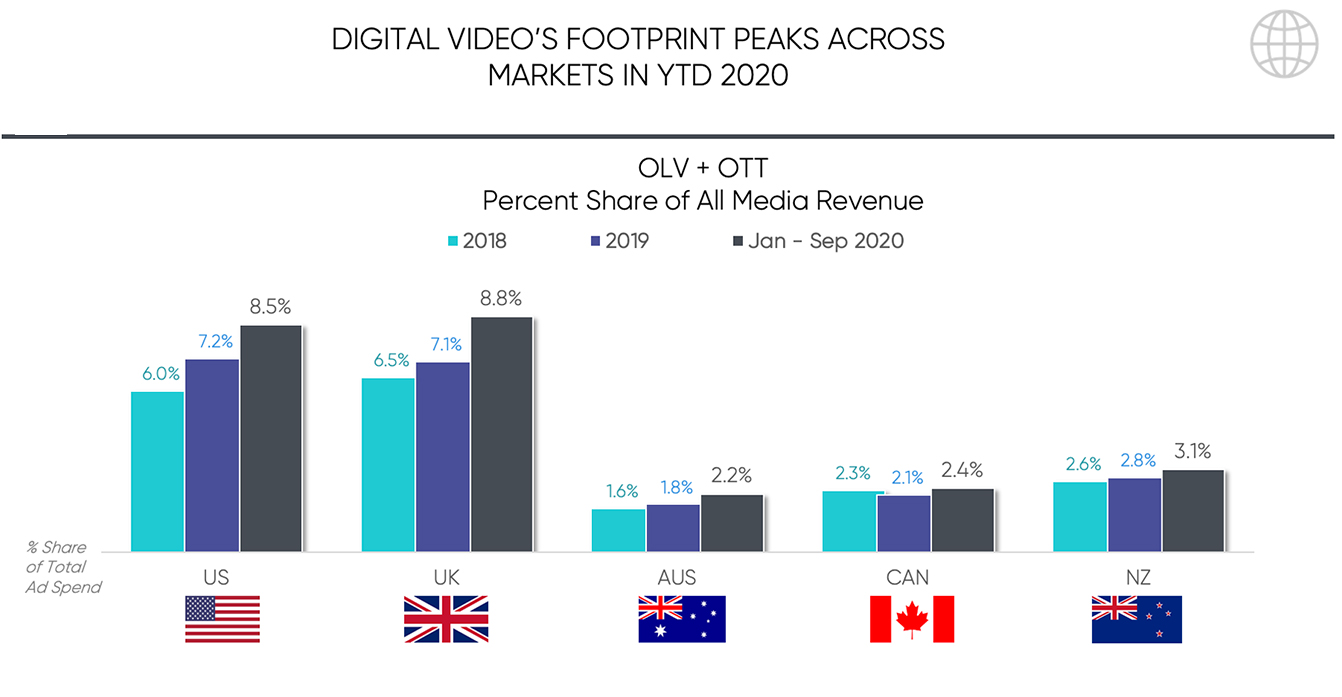
In all markets measured by SMI, the percent share of ad spend for Digital Video increased in 2020. Market share was greatest in the U.K. followed closely by the U.S. In both markets Digital Video allocation approached 10% share of media ad spend. Although not as robust (under 5%), share of ad spend was also growing in New Zealand, Canada and Australia. A strong indication OTT growth is global in scope.
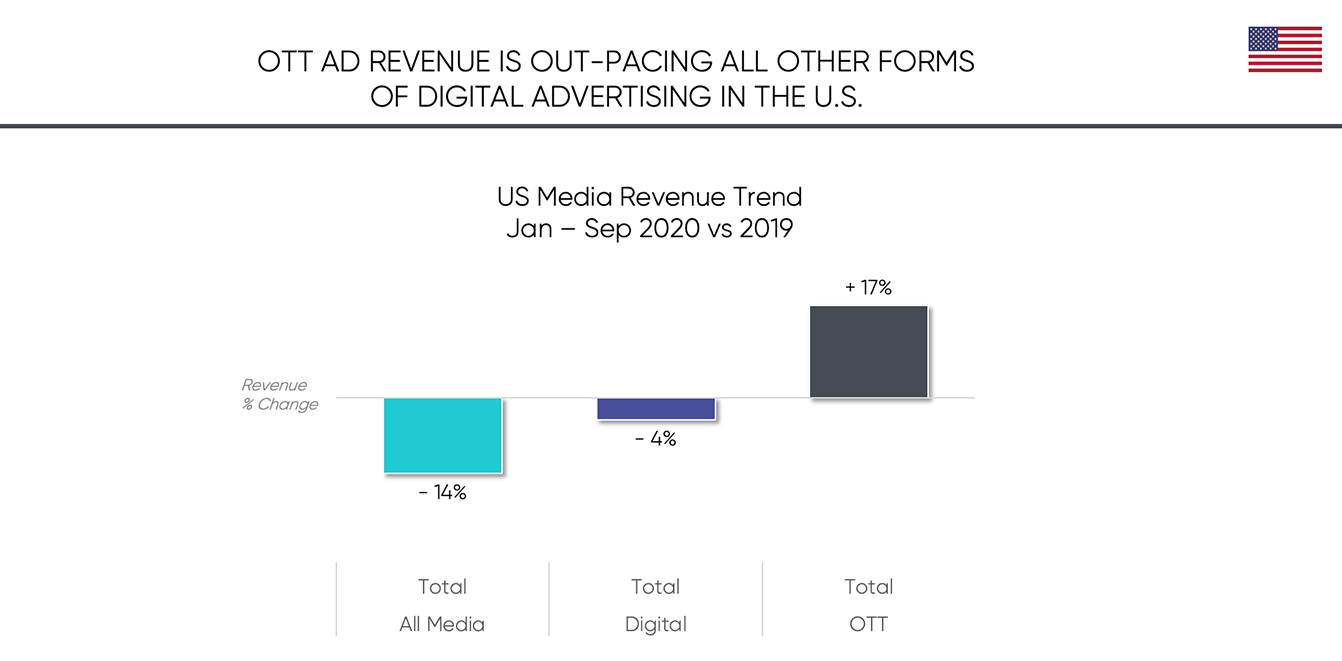
Looking at the U.S. Ad Market, OTT was a standout in 2020. SMI found year-over-year ad spend grew 17%. By comparison, total market ad spend was -14% while digital media was -4%. This OTT ad spend growth was fueled by growing audiences seeking streaming premium video services. From January to April 2020, the reach of AVOD services on connected TV was +9% compared to +5% for SVOD. Once the pandemic began, there was accelerated ad spend growth as dollars migrated from other media.
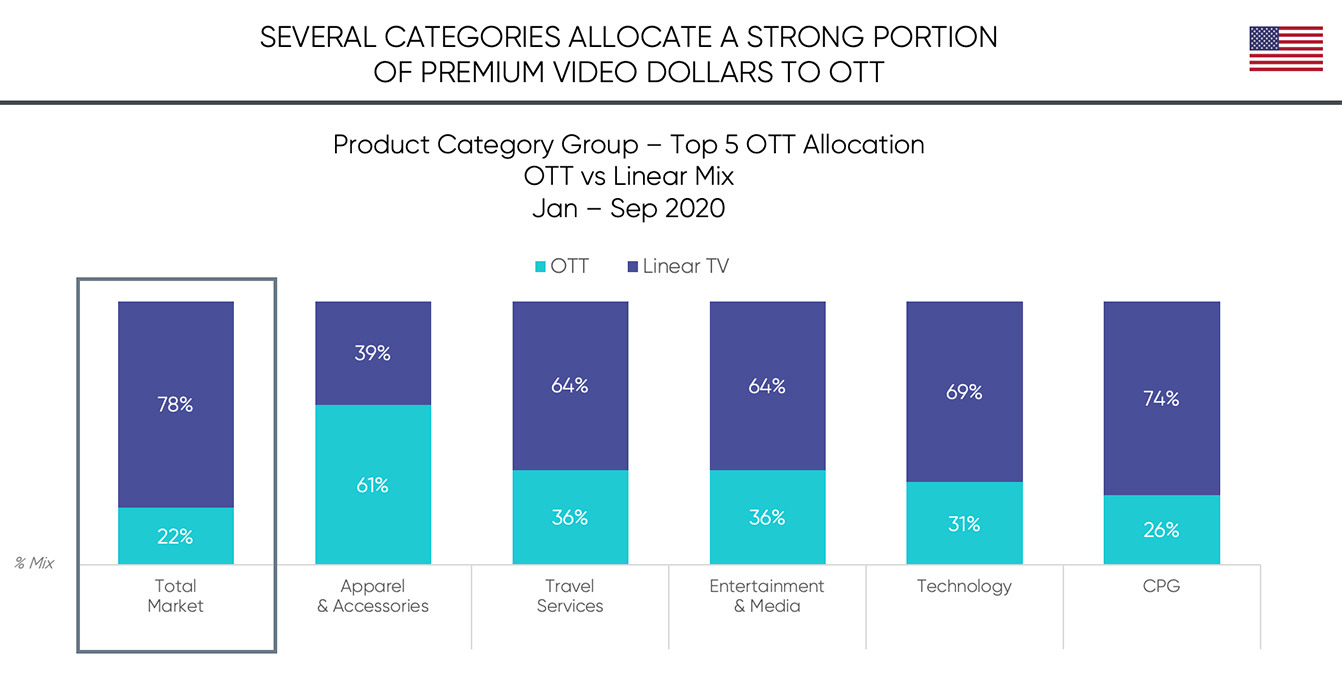
Advertisers note OTT provides a complement to linear TV; a younger audience that reaches cord cutters, better targeting capabilities with greater efficiency and often fewer commercials than linear TV. SMI found in 2020, 22% of premium video ad spend were allocated to OTT with 78% going to linear TV.
While all advertisers are allocating more dollars to OTT, among product categories, apparel & accessories allocated the most, with 61% of their premium video ad budget going to OTT, by far the most of any category. Other categories above average were travel services (36%), entertainment & media (36%), technology (31%) and CPG (26%).
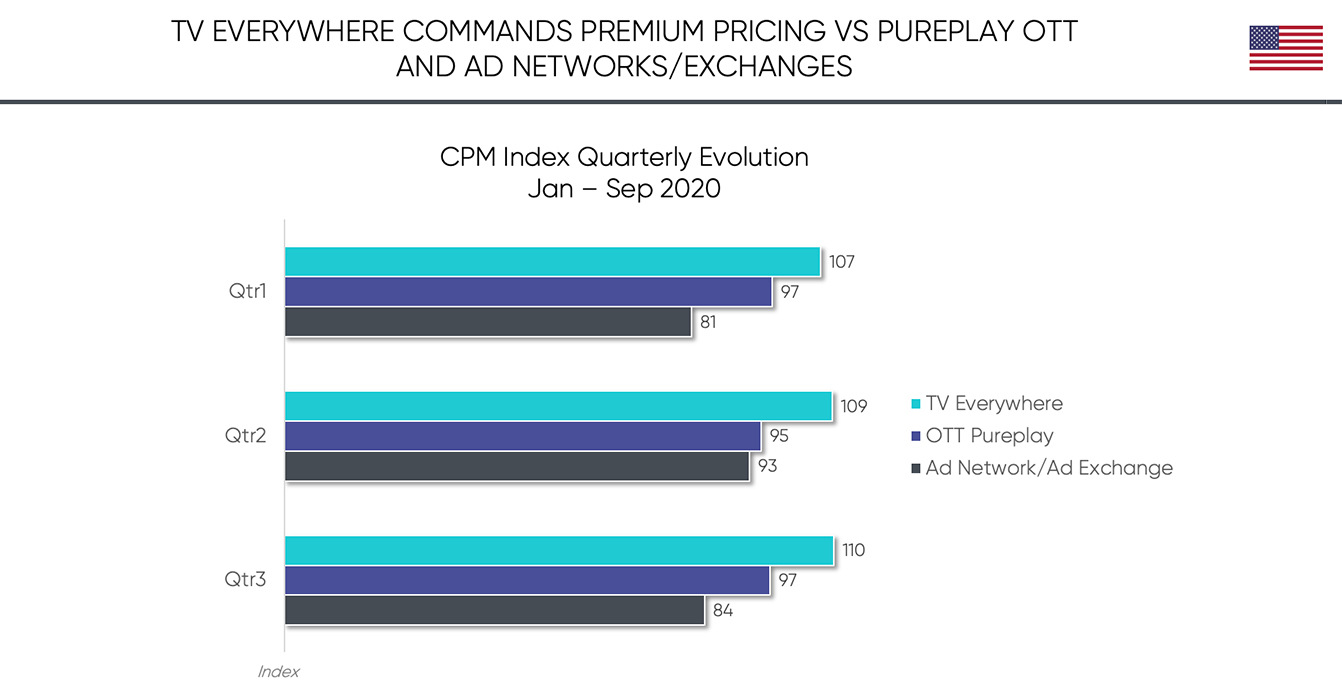
Looking at OTT by sub-type, advertisers are paying a premium price for TV Everywhere compared to OTT Pureplay and Ad Network/Ad Exchange. TV Everywhere is video content from networks authenticated by MVPD’s. In 2020 NBCU captured the most incremental investment in ad spend. Among OTT Pureplay, the AVOD Hulu, received the largest incremental investment in ad spend (and most of any provider) followed by Roku. Ad Network/Exchange had the lowest CPM although The Trade Desk had significant ad spend growth.
In 2020, streaming video had a breakthrough accounting for 25% of total TV usage in the second quarter, up from 19% in fourth quarter 2019. Several new providers, led by Comcast’s Peacock, were launched while other providers reported strong subscriber gains.
Looking at 2021, industry analysts project continued OTT growth, Discovery+ will launch as a hybrid streaming video service in January (AVOD and SVOD), HBO Max could introduce an AVOD service in the 2Q and ViacomCBS will be relaunching their streaming video products. The services will be rolling out worldwide ensuring continued ad spend growth domestically and globally.
SMI’s data and market intelligence for the OTT category have been enhanced by our introduction of a new, more granular taxonomy that provides actionable insights at an OTT sub-type level. We will continue to track the ad spend, ad revenue, and pricing within this growing market, helping you make smarter media decisions.
Connect with us today to learn more about how SMI’s marketing intelligence can help you make smarter decisions
Complete and submit the form below and we will be in touch soon.


