SMI Core data captures the actual spend data from the SMI Pool partners of major holding companies and large independent agencies, representing up to 95% of all US national brand ad spending, to provide a complete monthly view of the SMI Pool market size, investment share and category performance. Core Data delivers detailed ad intelligence across all media types, including Television, OTT, Digital, Out of Home, Print, and Radio.

Topline Insights

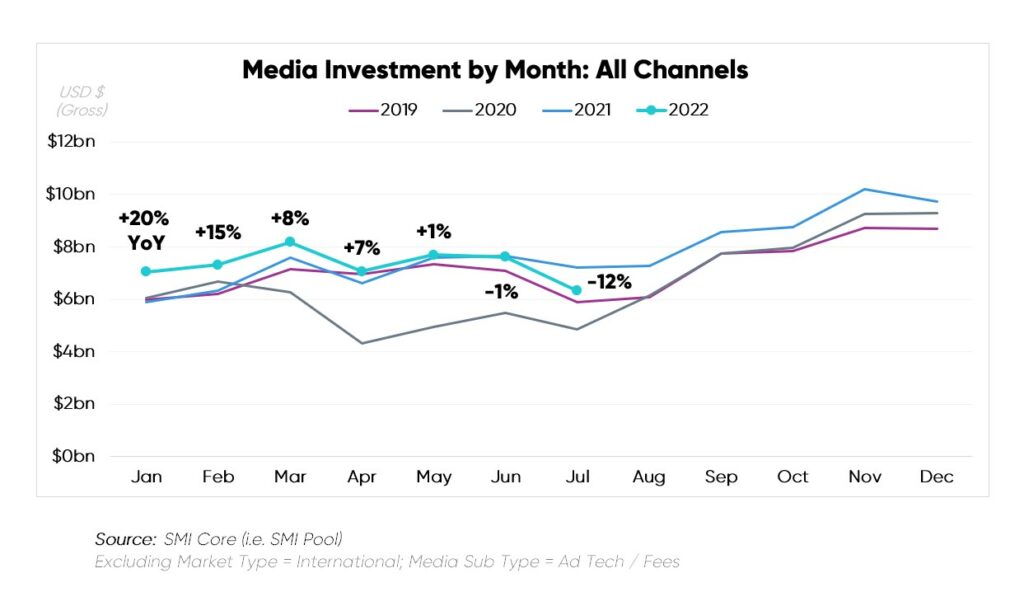
Advertising expenditure fell -12% during July 2022 vs. 2021, as major telecasts shifted out of the month.
Without the Olympics airing on NBC this summer, and with the NBA Finals shifting to their typical June schedule on ABC, these absent dollars weighed down July 2022 performance.
To proxy the health of the market without the above outliers, the ad market held stable at +2% when excluding Comcast / NBCU and Disney from consideration.
Insights by Media Type
 Preliminary Q3 2022 (July only)
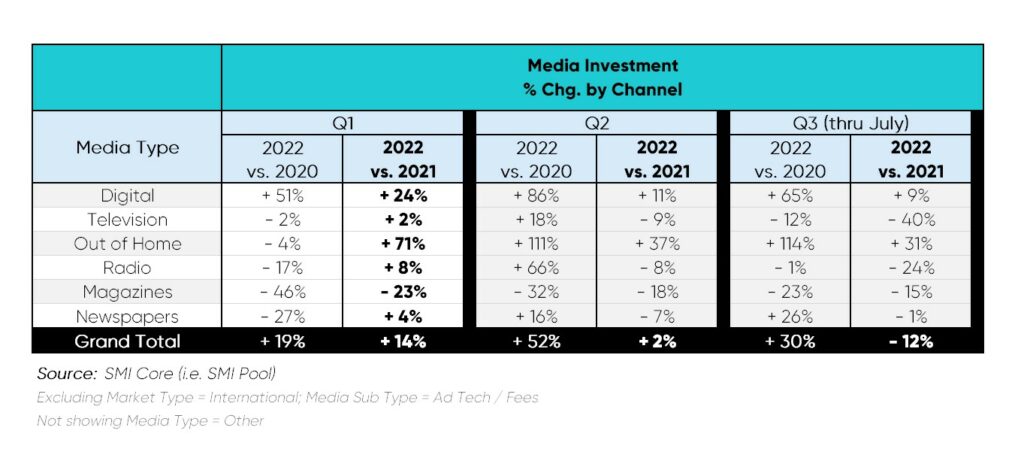
- Digital thus expanded its share position to 65% of ad dollars, a +13%pt increase vs. last year when the Olympics & NBA Finals bolstered Traditional via Linear TV.
Newspapers also represented a point of stability relative to July 2021 thresholds, while the other offline channels receded by double digits.
Insights by Media Owner
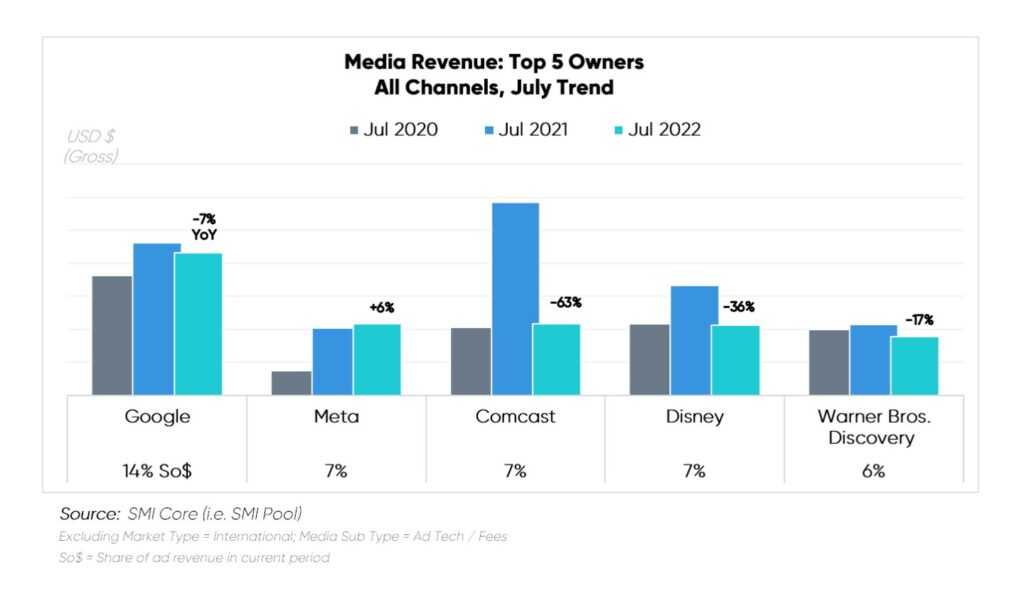
 Meta, Comcast, and Disney held an equal 7% share of ad revenue via the SMI Pool. Only Meta, however, expanded among the Top Five Media Owners in July 2022 vs. 2021.
- Meta revenue reached an all-time high for July, per SMI Core which dates back to 2017. Contextually, Meta climbed back from the July 2020 Facebook protest trough, which marked a lowpoint in SMI Pool revenue last seen in Jan & Feb 2017.
- Comcast / NBCU experienced deep declines across Broadcast (-79%) and Cable TV (-50%), given its major networks carried the now dark, high value Tokyo Olympics last summer.
- Disney faced Broadcast TV (-65%) and Cable TV (-14%) divestment, primarily as ABC’s coverage of the NBA Finals shifted back to its normal June time frame.
Insights by Product Category Group

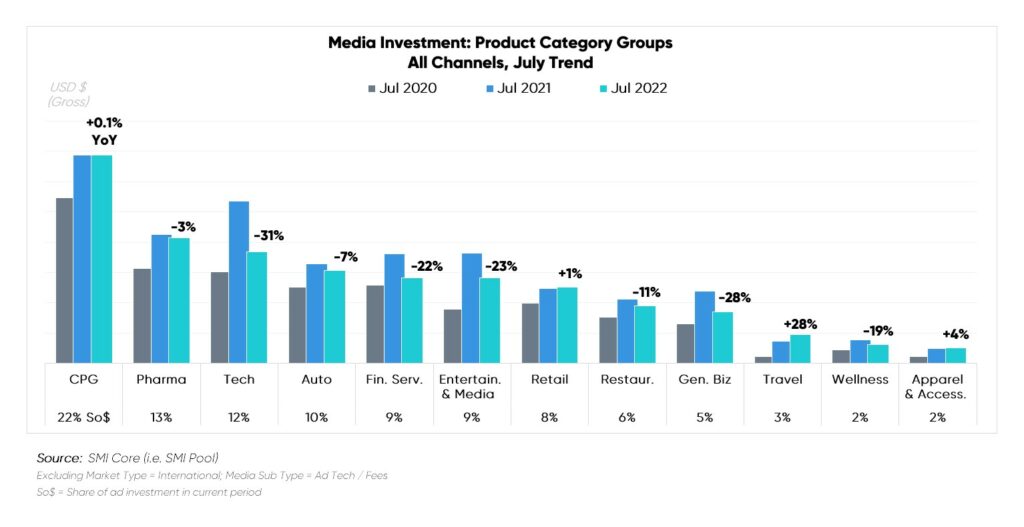
In July 2022, the majority of Product Category Groups reduced ad spend for the second consecutive month.
The number of growing sectors continued to dwindle, reaching four this month, compared to five last month, and ten in Q1 2022 months.
- Travel, Apparel & Accessories, Retail and CPG Category Groups expanded and sat at peak levels for the month, representing an opportunity for media companies.
Travel represented the strongest lift year-over-year, a position held every month from April 2021 onward. Travel expenditures have quadrupled vs. 2020 pandemic levels.


