SMI Core data captures the actual spend data from the SMI Pool partners of major holding companies and large independent agencies, representing up to 95% of all US national brand ad spending, to provide a complete monthly view of the SMI Pool market size, investment share and category performance. Core Data delivers detailed ad intelligence across all media types, including Television, OTT, Digital, Out of Home, Print, and Radio.
Topline Insights
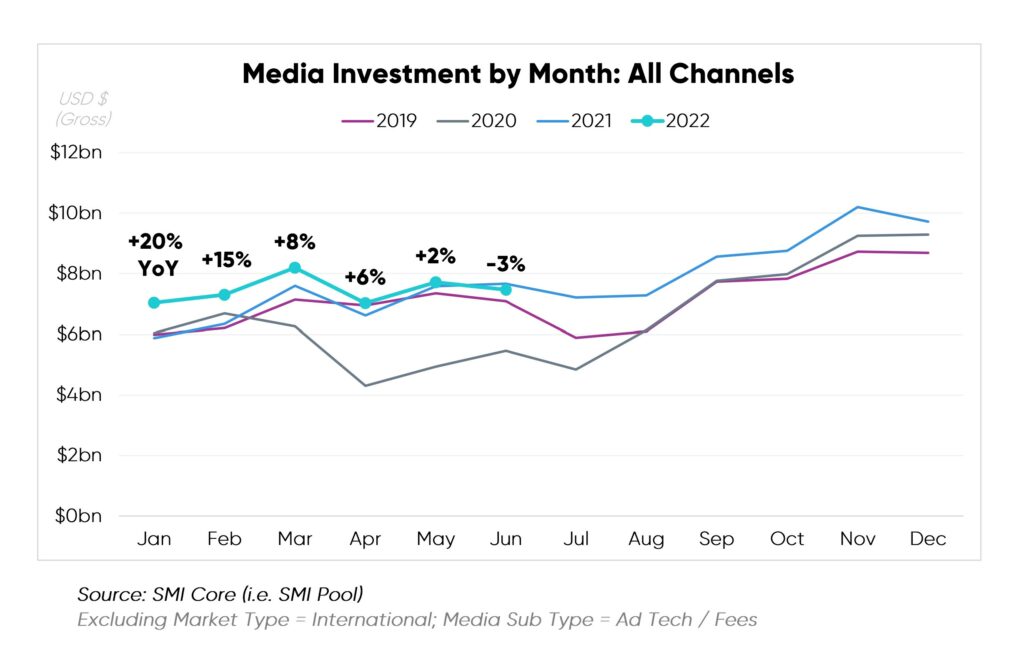
In June 2022, monthly ad spend evolution entered negative year-over-year growth territory for the first time this year, shifting down -3% vs. last year. This decline broke a fifteen-months expansion of YoY ad spend growth. The last monthly decline observed was in February 2021 compared to Feb 2020.
While the NFL Season and Olympics bolstered early 2022 activity, consecutive months steadily tapered, amidst various reports of recession concern. (See SMI Insights Blog Series: Recession Planning)
Although Digital posted +9% lift in June 2022 YoY, Linear TV receded -19% YoY. Such Linear TV decline last occurred in July 2020, back in the era of Covid sports disruptions.
Insights by Media Type
 Q2 2022
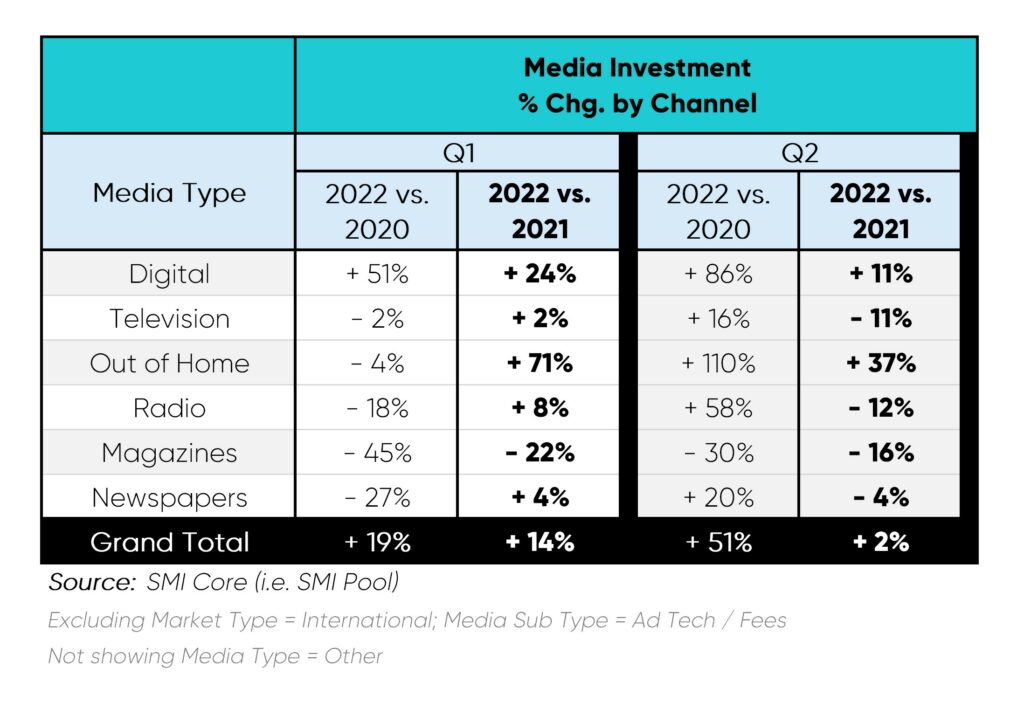
Digital Media continued to grow in Q2, representing a 58% share of dollars. CPG and Financial Services marketers supported the largest volumetric ad dollar increase in Q2 2022.
Linear TV ad spend declined during Q2 2022. Cable TV fell -14%, roughly $600MM+, pulling down performance. Only two Product Categories, Travel Services (+84%) and Apparel & Accessories (+21%), sustained growth in the space.
OOH maintained the fastest growth rate throughout the quarter. Pharma, Entertainment & Media, and Technology accounted for more than half of OOH ad dollars.
Insights by Media Owner
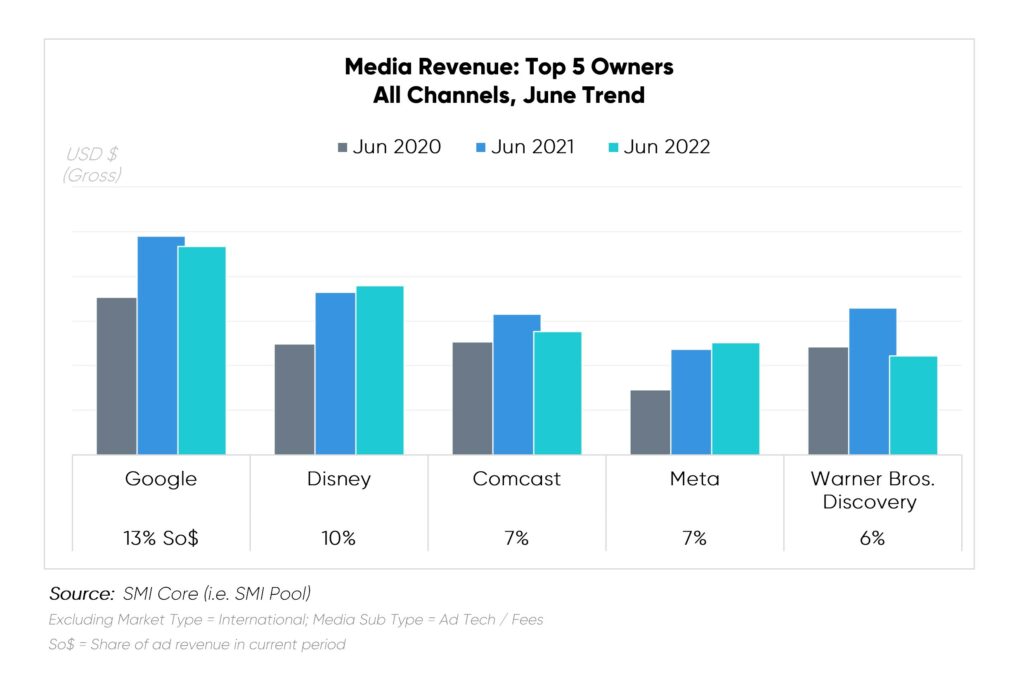 Meta (+6%) and Disney (+4%) showed modest growth in ad revenue in the SMI Pool during June 2022 vs. 2021.
- Meta reached a new high for the month, now +72% above June 2020 (two years ago) spend levels. CPG, Pharma, and Entertainment & Media represented more than half of revenue.
- Within Disney, Traditional dollars shifted between Cable & Broadcast in accordance with the right-sided NBA schedule. (i.e., Cable TV / ESPN declined as the NBA Conference Playoffs shifted a month earlier, and Broadcast / ABC increased as the NBA Finals returned to June for the first time since 2019)
Warner Bros. Discovery Digital ad revenue jumped +32% vs. June 2021; however, the gains were unable to balance declines in Linear Television which fell -39% YoY. As with Disney, the shifting NBA Conference Playoffs schedule impacted Cable / TNT.
Insights by Product Category Group
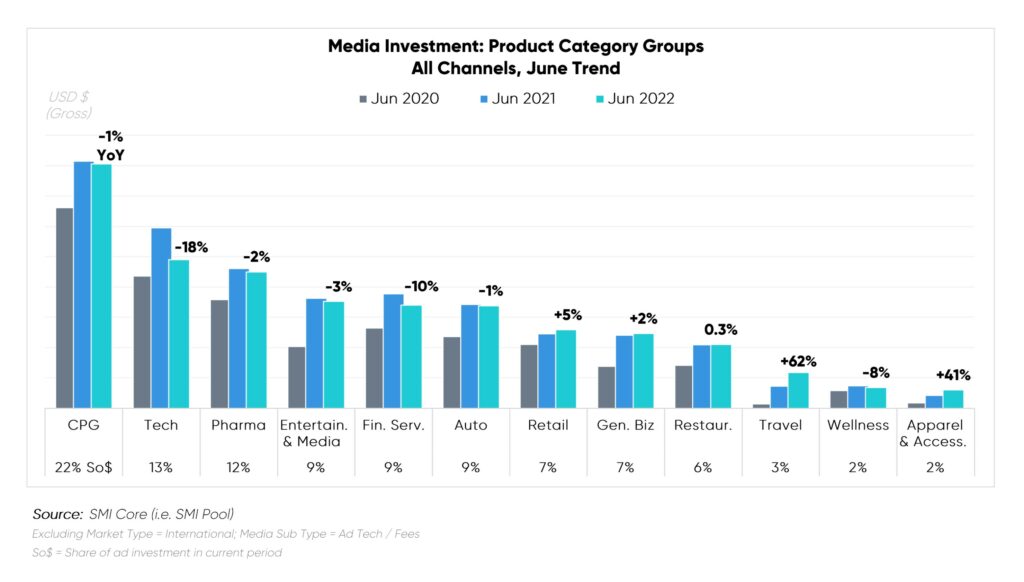
June 2022 marked the first month this year that the majority of Product Category Groups reduced ad spend. In fact only five sectors increased ad spend this month, a sharp reduction compared to ten growing categories in January, February, and March.
Moreover, two sectors newly shifted into decline during June, namely Entertainment & Media and Financial Services.
One bright spot, Retail rose to peak levels for the month of June. With rising consumer prices, Discount Store marketers sought the attention of value shoppers. The sector quadrupled investment YoY, countering declines across all other Retail subcategories.