Recession Planning, Part 1: What a broad recession would mean for the ad industry
Part 1 in a 4-part series on recession planning for advertising
By John Spiropoulos
 The possibility of a broad economic recession is here but not assured. In this series, SMI will look at how the ad market can react to economic volatility as well as how marketers and media companies can plan.
Recently, the Bureau of Economic Analysis (BEA) released the second estimate of 1st quarter GDP, with a revised view that the economy contracted by -1.5% (see Understanding GDP below for more details). This was a revision from last month’s Advanced release at -1.4%; additionally, this served as the first read on Corporate Profits, showing a quick negative turn at -4.3% after slowing throughout 2021.
These declines need to be considered against the backdrop of a post-COVID economic surge. So, are they pure economic contraction or the roller coaster of recovery?
SMI is not in the business of economic prediction nor political dialog regarding financial issues. Every reader should consider the implications of the following list of just some contributory events to the main issue in our collective mindset, inflation:
- 2017 Tax Cuts and Jobs Act
- Minimum wage spikes
- COVID-related wage-replacement payments
- Stock buyback programs
- Capitalism
- Socialism
- Federal Reserve policy lowering interest rates while the economy was growing from 2019 to pre-COVID 2020
- Federal Reserve policy from 2021-2022, pre-announcing rate growth for a year, artificially stimulating demand, then spiking rates starting in Q2/2022
- Russia’s invasion of Ukraine
Where you stand, politically-speaking, will drive what you think the underlying cause of our current economic inflationary environment is. That list alone provides plenty of fodder for everyone. The National Bureau of Economic Research (NBER; see links) will have a say too.
The point is, we’re here, so what should readers do about the various potential scenarios, and what will be the implications to the advertising market, to media publishers, and to marketers? These topics will be covered in this series.
Predicting the Ad Market
But the ad market has been strong. Year-over-year growth has been solid, but decelerating all through 2022-to-date:
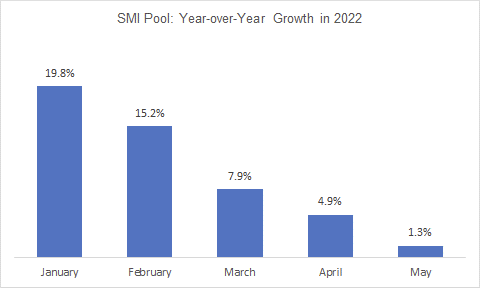
Source: SMI Pool
The history of predicting the ad market is an interesting endeavor. It’s important to read the underlying concepts to the predictions. It’s also important to understand what you’re trying to predict: the market or a product category? There are significant differences and requirements for each.
Until The Great Recession, many forecasters used consumer-side variables in their core inputs for broad full market and media forecasts. These included hard data like Consumer Spending (itself a component of GDP) and soft measures like Consumer Confidence. Those proved successful during normal or stable periods of small economic growth. Unfortunately, consumer-side variables tend to be lagging indicators of economic health, particularly soft measures.
Forecasts based on business-side metrics proved far more successful at gauging changes in marketer outlays to advertising. After all, it’s those same businesses which make the products which they then market (including advertising). Metrics like Industrial Production and Corporate Profits proved far more successful at gauging the trough and recovery curve of The Great Recession for advertising.
Therefore, the connection to the Preliminary GDP result above (and the first inclusion of Corporate Profits) is key to the ad market.
As a reader of this post, do not think there’s a direct relationship of Corporate Profits (or any other metric) and ad spend. Those relationships are more nuanced and require modeling (which may include lagged variables, etc.). For instance, Industrial Production, via the latest reading for April 2022, was still positive (see links).
Moment of Focus
To put it lightly, there are mixed signals in the broader economy between contraction and limited growth. The former is getting louder and includes those metrics with direct relationships to ad spend (and all the effects that creates). We’re in a prolonged state of potential triggers (Russia’s invasion of Ukraine, for example) but as-yet unrealized panic.
Without that panic-based moment of focus, we’ll exist in a scenario of one-or-two steps forward then two-or-one steps back. Think of it as economic purgatory. However, the market is ready for a trigger.
What is clear today is that we’ve re-learned the first lesson: there is no such thing as endless and unbounded growth. Part of the employment issue (extremely low unemployment couple with record job availability) is, in part, due to corporate planning of seemingly endless growth. 2022 will see a correction to this thinking in more ways than one.
Determining Impact
For the purpose of the next pieces in this series, we’ll look at past recessionary periods to understand what marketers did and how media reacted to those changes. Importantly, media evolves – so there’s no direct comparison.
However, one truth will remain: broad economic distress forces marketers to adapt faster than normal to media’s evolution. This was seen during The Great Depression, The Great Recession, as well as during COVID-19’s brief impact to the ad market.
Interesting issues are COVID and Digital’s current media mix share. COVID was so recent that the media mix may not have the room to change (as much) as seen in the past. Moreover, the SMI Pool shows Digital at almost a 60% share. Traditional media may not have a lot of room to fall and choices this time might be within Digital itself. But that’s what we’ll look at next.
What Should Be?
Again, this is a tricky question. Here, we’ll briefly offer one scenario. Looking at 2017-2019 ad spend patterns by the SMI Pool, pre-COVID, we can see the ad market was way too hot from mid-2021 to early 2022 but has already cooled.
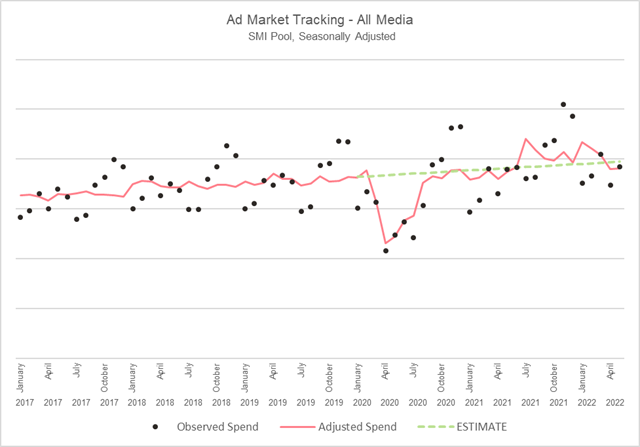
Source: SMI Pool
To keep things simple, we’re seasonally adjusting the SMI Pool based solely on the 2017-19 period to avoid COVID impact (normally, seasonal adjustments move forward through time). SMI-reported values are the dark dots while the seasonally adjusted values are shown with the red line. A linear projection of the seasonally adjusted values is shown for 2020 through 2022-to-date.
This is our first indication of ad market behavior under the assumption that a linear trend of seasonally adjusted values (based on 2017 to 2019 growth) is meaningful in its application from January 2020 to May 2022.
Under this assumption, the market became over-heated in July 2021 (where the red line jumps well above the dashed green line). It maintained strength through March 2022. Interestingly, the seasonally adjusted values for April and May 2022 are BELOW the assumptive estimate by roughly 3.5%. What’s more, May 2022 is up a seasonally adjusted 1.8% YoY. These are the first reads on a cooling ad market.
Understanding GDP
GDP, in common discussion, is both seasonally adjusted and annualized. This means the read-out for 4th quarter can be directly compared to 3rd quarter. It also requires the user (and any analysis of the result) to implicitly accept issues from the adjustment process. Included in their release, the BEA offers the exact measures (i.e., unadjusted figures).
GDP is released in three phases. The first release, the Advanced release, is made public one month after the end of each quarter. The second release, the Preliminary release, is two months after the end of the quarter with additional information (like Corporate Profits noted above) and some reconciliations. The third release, the Final release, is reported three months after the end of the quarter.
About the Author
John Spiropoulos, a special contributor to SMI Insights, has many years of experience on the buy- and sell-side of the advertising industry, including a past focus on both linear TV and digital media.
Other Posts in This “Recession Planning” Series
- Part 2: One thing to expect from a recession: restacking of the media mix
- Part 3: Publishers, diversify your mix before the economy does it for you
- Part 4: Brands, know your fundamentals and keep goals flexible
Sources for this post
- GDP
https://www.bea.gov/news/2022/gross-domestic-product-second-estimate-and-corporate-profits-preliminary-first-quarter - Industrial Production
https://www.federalreserve.gov/releases/g17/Current/default.htm - NBER
https://www.nber.org - BEA
- https://www.bea.gov