Recession Planning, Part 3: Publishers, stay ahead of the changing mix accelerated by recessions
Part 3 in a 4-part series on recession planning for advertising
By John Spiriopoulos
 Each economic recession is different.
One general rule observed, however, as discussed in Part 2 of this series, is that the media mix is liable to change rapidly. Periods of economic hardship seem to create the confluence of conditions necessary to accelerate media change, including new technologies, and changing preferences by consumers and advertisers.
What does this mean in terms of planning for the 2022-2025 period?
Resetting the Media Baseline
The future of media is about publishing and, more specifically, digital publishing. As discussed in Part 2, The Great Recession drove marketers to electronic media and publishing channels.
Media channels (not publishers) in Print, Directories, and Direct Mail have suffered due to ease of entry for pure play digital alternatives.
Audio has been ever evolving with the growth of Podcasting and Streaming. Here, too, there has been an ease of entry for pure play digital platforms due to rights access (e.g., Spotify, Pandora, etc.).
Video has been the great exception. As Netflix is demonstrating, ease of entry is available, but the medium leaves the entrant highly dependent on copyright holders. The opportunity remains great, and after watching the text-based content and audio spaces, video publishers are moving fast into streaming due to technology gains (e.g., 5G and related technologies; see the Upfront series for more context, also on the SMI Insights blog).
Digital Publishing offers overlapping opportunities for both publishers and marketers. In the scenario of near-term economic weakness, that intersection will be the foundation of the market efficiencies needed for both sides to advance in a market downturn.
Here are questions publishers may be asking themselves:
- For text-oriented publishers, can you offer advertisers a price-efficient option to reuse existing video ad assets compared to the value proposition presented by video publishers? What about audio ads?
- For video publishers, what opportunities do you have to offer for display or other ad formats, which can bring down a site-wide package price-point?
- What is your strategy for your clients trying to market their products (beyond advertising)?
- What is your eCommerce strategy?
- What is your Data strategy?
Staying Ahead of the Changing Media Mix
Here’s how those points play out for both Audio and Video Publishing according to the SMI Pool of advertisers.
Total Video Ad Ecosystem by Ad Formats
| 2021 Ad Revenue (in billions) |
Share of Market | 4-Year CAGR |
|
| Linear Video Publishing – Video Ads | $37.9 | 65% | -2.2% |
| Digital Video Publishing – Video Ads | $11.7 | 20% | +30.5% |
| Digital Video Publishing – Non-Video Ads | $1.2 | 2% | +7.6% |
| Platforms & Exchanges – Video Ads | $4.2 | 7% | +18.2% |
| Other Media – Video Ads |
$2.9 | 5% | +18.9% |
| TOTAL VIDEO AD ECOSYSTEM |
$57.9 | 100% | +3.7% |
Source: SMI Pool, Core 2.0, shares may not add to 100% due to rounding.
Video ad ecosystem includes Linear TV ads, the Digital Video ad type, and non-video ads on Digital Video publishers.
Video publishers are gaining significant traction with non-video ads ($1.21b, +8% CAGR 2017-21). This includes legacy-linear video publishers that are adapting to the market faster. This growth is on top of that experienced for their Digital video ad products.
Even stronger are those non-video publishers finding a way to incorporate video ad products. This includes off-line options like Cinema, as well as Social ($1.38b, +56% CAGR 2017-21) and non-video Digital publishers ($1.48b, +15% CAGR 2017-21).
A key component of the Video Ad Ecosystem is OTT (it’s within Digital Publishing), including those legacy-linear publishers or their content within the Digital Publishing world. OTT was 15% of the Video Ad Ecosystem in 2021 ($8.7b, +42% CAGR 2017-21). Online Video, the other component of Digital Video Publishing, is growing nicely within the SMI Pool but at a much slower pace ($2.9b, +12% CAGR 2017-21).
Total Audio Ad Ecosystem by Ad Formats
Audio publishers are gaining even more traction (10% market share vs. 2%) than their video counterparts with non-primary ad products (“Non-Audio Ads”; $391m, +13% CAGR 2017-21). The driver of this is a longer-term foray into Digital advertising. Video, as noted previously, is a late entrant to Digital due to bandwidth capabilities.
| 2021 Ad Revenue (in billions) |
Share of Market | 4-Year CAGR | |
| Broadcast Radio Publishing – Audio Ads | $2.0 | 50% | -4.8% |
| Digital Audio Publishing – Audio Ads | $1.3 | 32% | +24.2% |
| Digital Aud. Publishing – Non-Audio Ads | $0.4 | 10% | +12.6% |
| Platforms & Exchanges – Audio Ads | $0.3 | 7% | +86.7% |
| Other Media – Audio Ads | <$0.1 | 2% | +45.4% |
| TOTAL AUDIO AD ECOSYSTEM | $4.0 | 100% | +5.4% |
Source: SMI Pool, Core 2.0, shares may not add to 100% due to rounding
Audio ad ecosystem includes Broadcast Radio (Terrestrial/Satellite) ads, the Digital Audio ad type, and non-audio ads on Digital Audio publishers.
Interestingly, non-audio publishers are much less likely to offer audio ad products than video (2% of Audio Market share vs. 5% for the Video Market). Pictures, moving or still, are key for user attention without a seamless content-created experience.
A key component of the Audio Ad Ecosystem is Podcasting (it’s within Digital Publishing). Audio Podcasting was 7% of the Total Audio Ad Ecosystem in 2021 as advertisers flocked to new offerings and programs. In 2017, it was hardly comparable at <1% market share.
Baseline of Advertisers: Large versus Rest of Market
In Part 2 of this series, we noted that the SMI Pool, which is composed of billing records for the biggest ad agencies, is not equivalent to the total ad market. The SMI Pool is highly representative of spending by the biggest advertisers in the U.S., with 90%+ coverage of national brand ad spending, the thousands of advertisers that spend millions on ads. But it does not include many medium and smaller advertisers that do not use the biggest ad agencies, i.e., the millions of advertisers that spend thousands on ads.
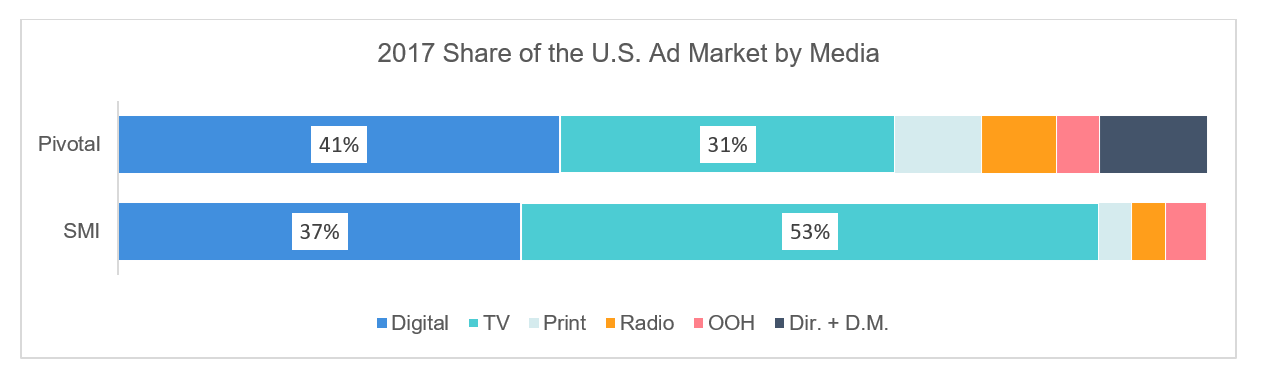
We used this graph previously to illustrate those differences, comparing the 2017 market mix for the SMI Pool to Pivotal Research’s estimate for the whole market.
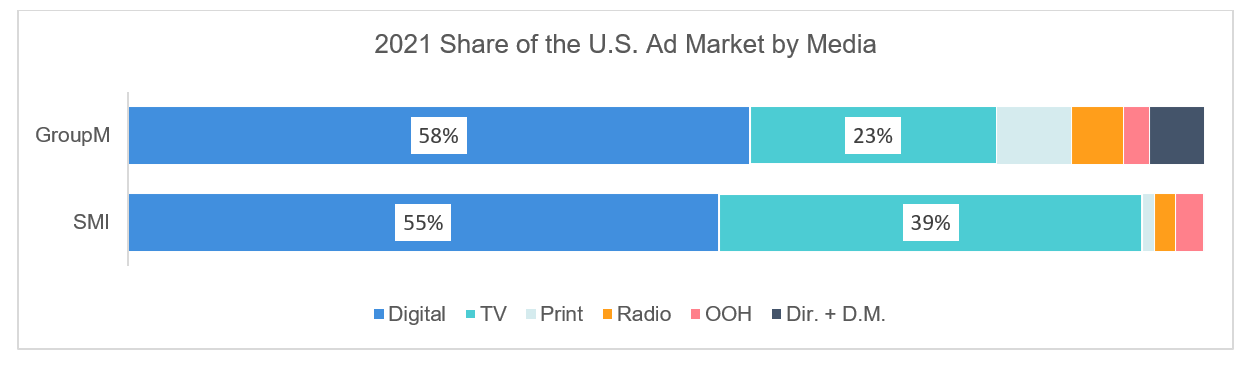
Here is the same comparison of the media mix distribution in the SMI Pool compared to GroupM’s most recent estimate, this time for the year 2021, four years after the earlier charted period; Brian Weiser was the same analyst for both, now Global President for Business Intelligence for GroupM, previously leading advertising analysis at Pivotal.
It’s important to remember that many small-and-medium businesses (SMBs) are local media-driven (including more reliance still on print, radio and OOH than national counterparts), and many do not use large agencies or agencies at all.
GroupM estimates 2021 saw $302 billion in U.S. ad spend (excluding political ads), which was 22% higher than their 2019 estimate. SMI captured $96 billion in U.S. ad spending in 2021, a 12% increase over 2019.
About the Author
John Spiropoulos, a special contributor to SMI Insights, has many years of experience on the buy- and sell-side of the advertising industry, including a past focus on both linear TV and digital media.
