Recession Planning, Part 2: One thing to expect from a recession: restacking of the media mix
Part 2 in a 4-part series on recession planning for advertising
By John Spiropoulos
 In this second post in a series about the media business during a time of economic turmoil and a possible recession, we’ll look at past recessionary periods and see how the media mix changed. Some of this was considered by SMI and published in our January 2022 COVID-19 Advertising Rebound Report.
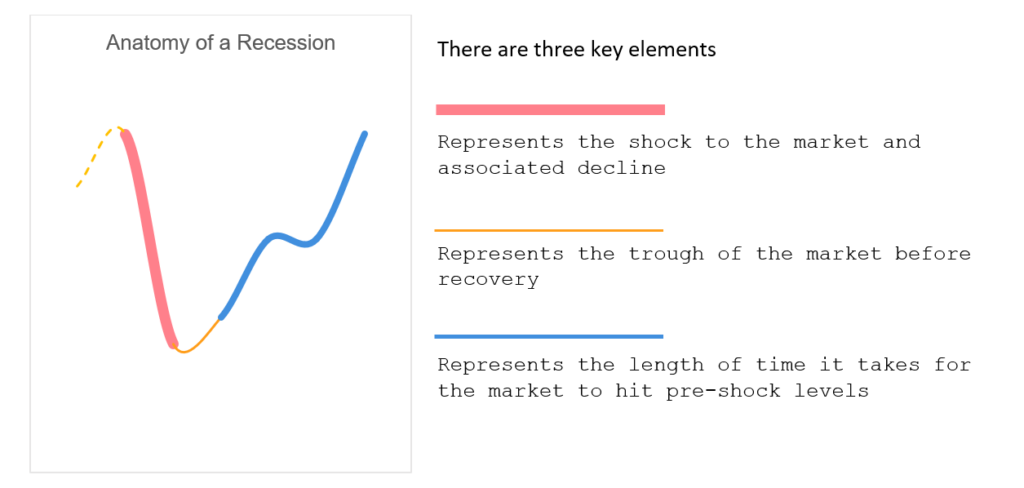
Anatomy of a Recession
No two recessions are the same. But there are three key elements, which are typical diagnostic tools:
- The Shock
- The Trough
- The Recovery
There are typical patterns as the case studies below will demonstrate. However, COVID-19 was an exception. As we move forward as a global economy, academics may end up combining COVID-19 economic turmoil with the potential new economic downturn. Importantly, this is only a potential outcome and should be scenario planned accordingly.
What’s more, this latest period may be best called a period of economic whiplashing triggered by COVID-19. It has both the positive and negative growth – oscillating at lower highs and lows through time. But that is conjecture.
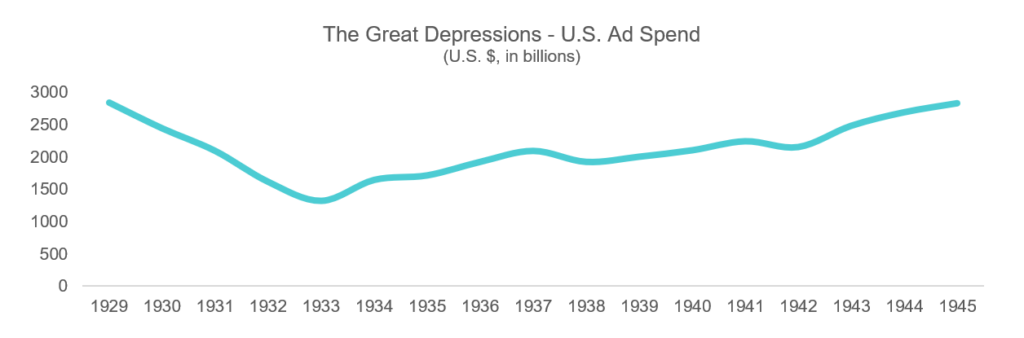
The Great Depression
 Source: McCann
The Great Depression was an extremely long event. It took the ad market four years to hit bottom, falling almost 55% in that time (1929 to 1933). The market stayed at bottom throughout 1933. Recovery took 12 years (to 1945), which is a long time due the depth and length of the fall. That length allowed recovery to be stymie by other factors (the start of what would become World War II in 1938 as well as the U.S.’s entrance into the War in 1942).
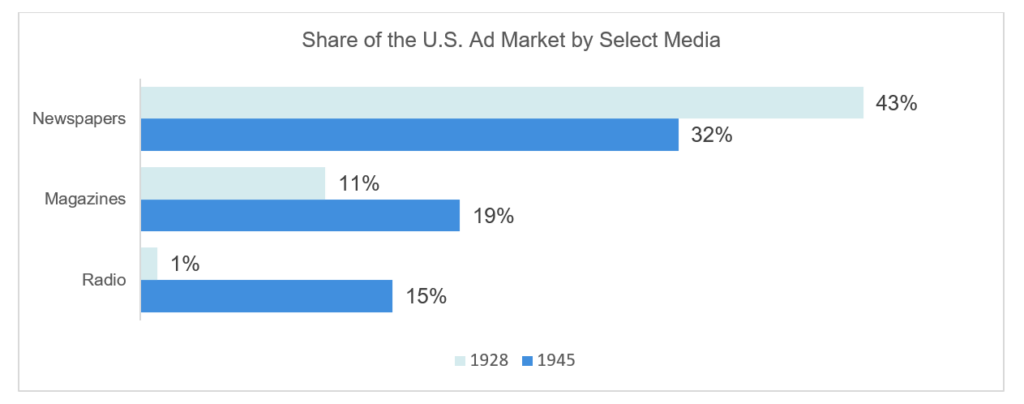
The length of time also allowed the growth and change of the media marketplace and the ad market which supports it. Data is sparse from those decades, so it’s best to look at the elements most known to have driven changes in the media mix. Newspapers, which had dominated the U.S. market (and globally) was being chipped away by newer media vehicles. Magazine nearly doubled in that time, while Radio soared. Collectively, these three media controlled two-thirds of the U.S. ad market in 1945 (up from a combined 55% in 1928, when most of that portion was to Newspapers alone).
Source: McCann
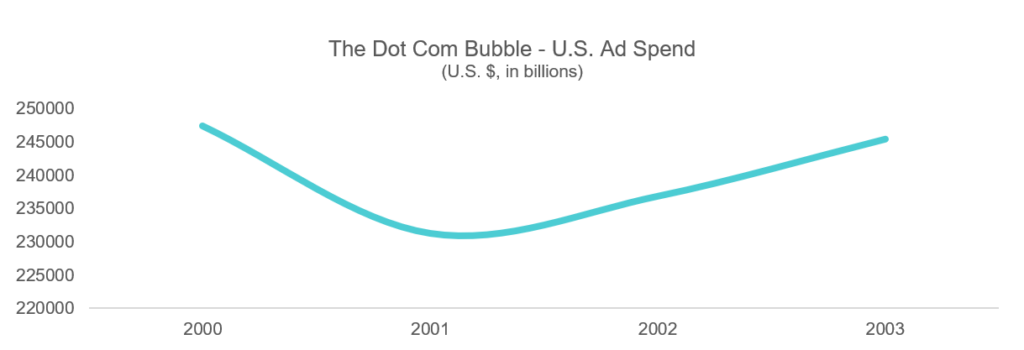
The Dot Com Bubble
 Source: McCann
The Dot Com Bubble, really the fall-out from that bubble bursting, was a short-duration event. The market hit bottom on a single annual cycle and recovered two years after that. real impact, although seen in total outlays (shown above), was really one of media pricing. The new Dot Com advertises paid top dollar for the ads they purchased and, generally, they were late to market and spent wildly. It wasn’t just revenue which disappeared for media publishers: it was, in many cases, a large chunk of their highest price-point clients.
Due to the short duration of the event, media mix changes were minimal. It was, however, the first time the Digital industry lost share, falling from 3% of the U.S. ad market to 2%. Print (Newspapers + Magazines), after peaking in the early 1940s at roughly 50% of the U.S. ad market, continued its downward slide falling from 27% of the market to 24%. Television (national and local) grew from 24% to a still-leading position of 25%.
The Great Recession
For The Great Recession and beyond, our source data is changing from McCann to Pivotal and SMI. Each source has different inclusions and should not be compared directly. Pivotal’s 2007 total is $4 billion, or nearly 20% below McCann’s 2003 total, despite market growth during the intervening period. Those differences impact comparisons of outlays ($) as well as media mix.
 Source: Pivotal Research (Brian Weiser)
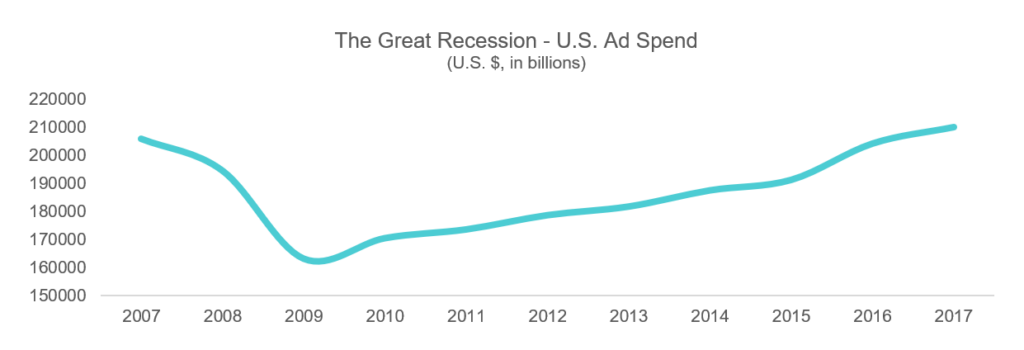
The Great Recession was a long-term event. It took two years for the ad market to fall roughly 20% (from the 2007 peak to 2009). It then took eight years for the market to recover (2009 to 2017).
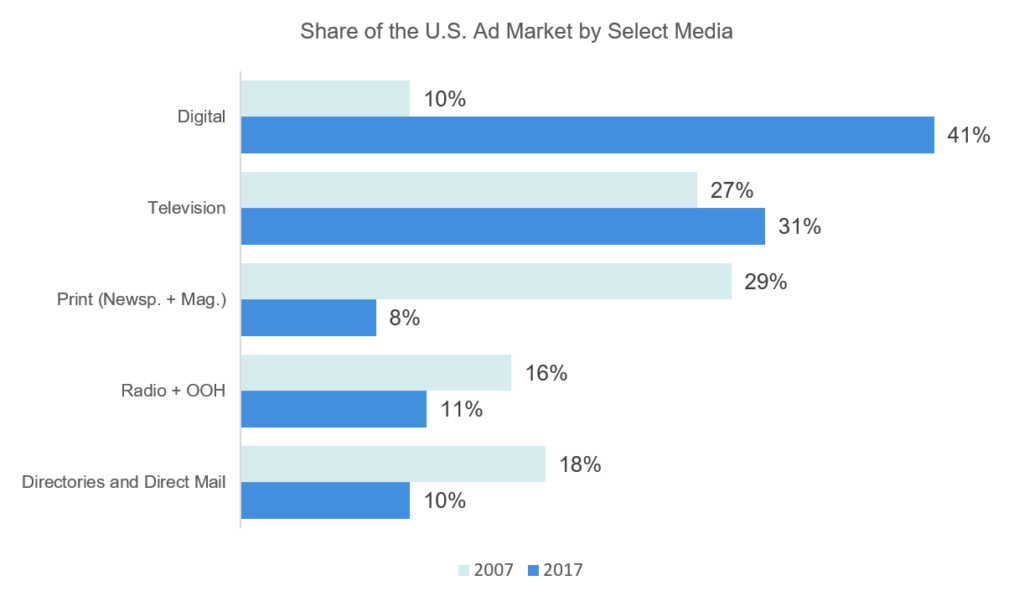
This is the last period where Digital media will be combined into an aggregate total. That’s due to scale. From 2007 to 2017 Digital grew from 10% of the ad market to 41%. It collectively overtook television. TV, however, still grew share in this period (from 27% to 31%) as the market consolidated to video and interactive/electronic media.
During this period, marketers drastically cut their print spend as well as in “below-the-line” channels (specifically Directories, Direct Mail, and off-line couponing). Collectively, advertising to these types fell 47% over the two periods, to 10% of the ad market by 2017. Search, Social, Digital Couponing, and other Digital channels absorbing those dollars.
By 2017, TV and Digital were over 70% of the market. This should NOT be thought of as marketers reducing their advertising channel selection (or media mix). Digital encompasses everything from email to search to ads in media publishing sites — basically, Digital forms and more from their off-line equivalents. It’s why bundling everything as “Digital” no longer makes sense.
Digital’s growth during this period was driven by converting the millions of small-and-medium businesses, those marketers who spend hundreds or thousands annually (vs. those that spend millions).
 Source: Pivotal Research (Brian Weiser)
Marketer Types
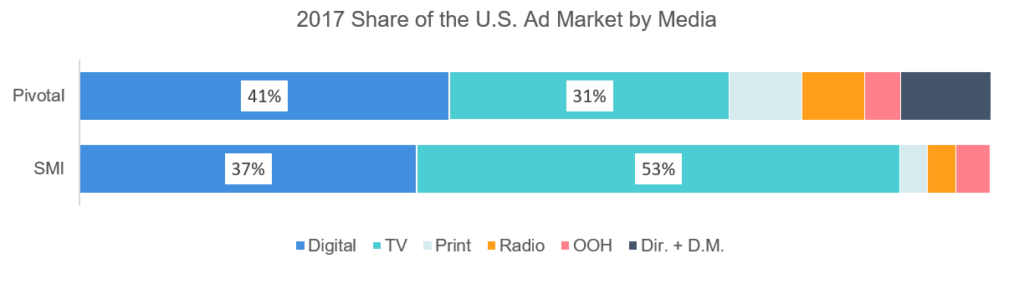
The rest of this article will focus on the largest marketers, a tier of the ad market which SMI has commanding coverage. For comparison, here are Pivotal’s 2017 media mix and revenue estimates (which includes all marketers) and spend data for the same year from the SMI Pool (which is mainly the largest marketers – those spending millions annually):
 Source: Pivotal Research (Brian Weiser) and SMI Pool
The media mix difference between large marketers and small is clear. TV remained the dominate vehicle for large marketers, where the SMI Pool shows 53% of the media mix for these advertisers. It’s the collective “other traditional” – much of which is local media – is collectively 28% for Pivotal’s total market estimate, and 10% within the SMI Pool of largest advertisers. Digital distribution is changing the paradigm connection of local media publishers and small-and-medium businesses as advertiser clients.
COVID-19 Pandemic
The COVID-19 pandemic provided the ad market (if not the broader economy) with a unique natural experiment. The headline is simple: a shocking fast decline with an even more shockingly fast recovery.
The Great Depression hit bottom FOUR YEARS after peak at -55% with a 12-year further recovery. The Great Recession took TWO YEARS to hit bottom, falling roughly 20% from peak using annual data, and had an 8-year recovery period. COVID-19’s (initial) impact AND recovery was within six months! Due to this fast-moving impact, quarterly data is shown. To eliminate seasonality, year-over-year change is used to demonstrate impact.
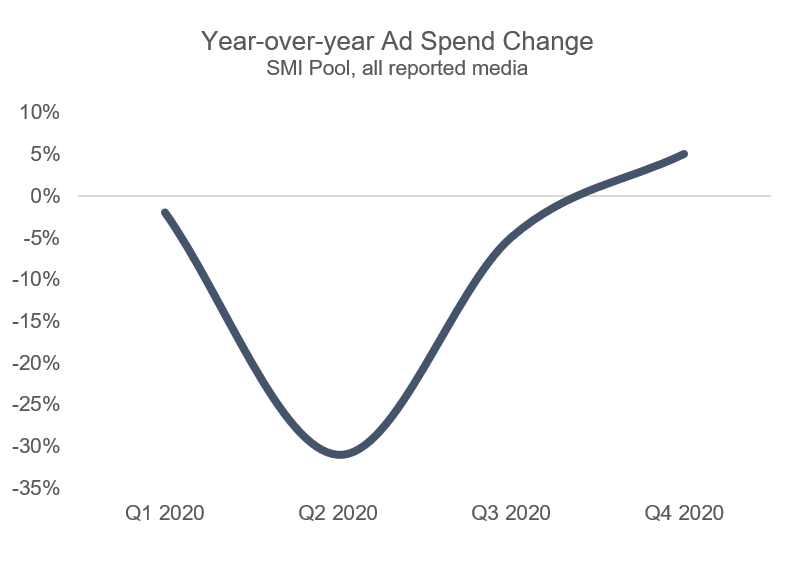
Source: Standard Media Index, SMI Pool
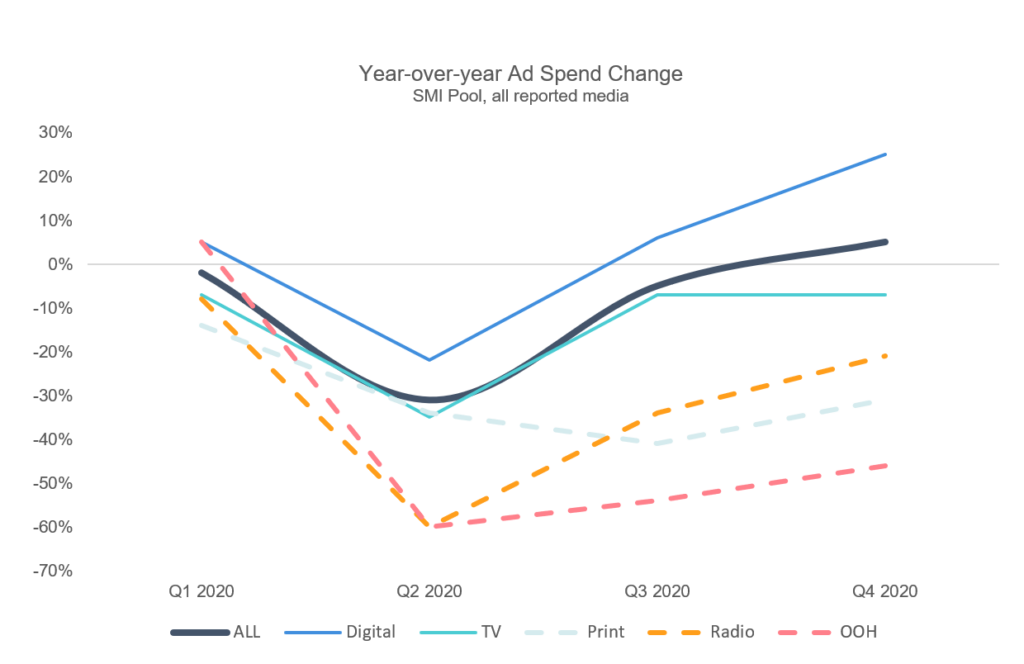
Despite this short window, there were significant media mix changes. Initially Digital media participated in the declines, falling 21% YoY in Q2/2020. This was a massive change for these media companies. However, it’s the continued weakness in non-TV traditional media that met expectations.
Below is the same chart as shown above but with media breakouts. By Q4/2020, Digital media was in strong growth (blue line) while no other media was close. This is the transition economic shocks create: step-change media mix adjustments. Television (teal line), though down single-digital in Q3-4/2020, held its own despite impact from sports cancelations.
Source: Standard Media Index, SMI Pool
The media mix change was significant. The smallest media lost nearly half of the media mix share (non-TV traditional media). The Video market’s transition to digital began in earnest during the pandemic with the coincidental launch of streaming platforms, themselves tied to 5G roll-out.
Buried in the Digital data is the minimal-growth result for Search. In both 2019 and 2021, Search platforms were 9% of the ad market according to the SMI Pool. Transition happens. Here, potential incremental gains for Search are being picked off by Social and eCommerce platforms – Amazon is cutting into Google’s world.
This means the growth for Digital non-Search is proportionally even larger: from 34% share in 2019 to 45% in 2021. On an absolute dollar basis, that’s 17% growth for Search while all other Digital grew by 42% combined.
Moving Forward
Marketers make incremental media mix changes during economic upheavals. The Video market is ripe for change, as it’s in a years-long transition to streaming. Streaming itself is about to go through another transition. Large players like Netflix and Disney+ have signaled willingness to bring ads into their platforms (Disney already has ad supported platforms in Hulu and ESPN+).
Until recently, the Video marketplace started with Linear as a base and then considered “everything else.” By 2025 that thinking will be a thing of the past. It will only spurred on by any economic weakness we may enter into over the coming months.
About the Author
John Spiropoulos, a special contributor to SMI Insights, has many years of experience on the buy- and sell-side of the advertising industry, including a past focus on both linear TV and digital media.